🦠 Long-Covid Data Investigation

* Disclaimer: I am not now, nor have I ever been an anti-vaxxer. This is a story, through real data, of my family's struggle with long-covid and the drastic and mysterious reaction my husband's body has had to both the covid virus as well as the vaccine. I am vaccinated and glad I am.
** Please see the links included throughout this article for full Jupyter notebooks of this project. (This link contains all 4 notebooks combined in PDF format.)
Introduction:
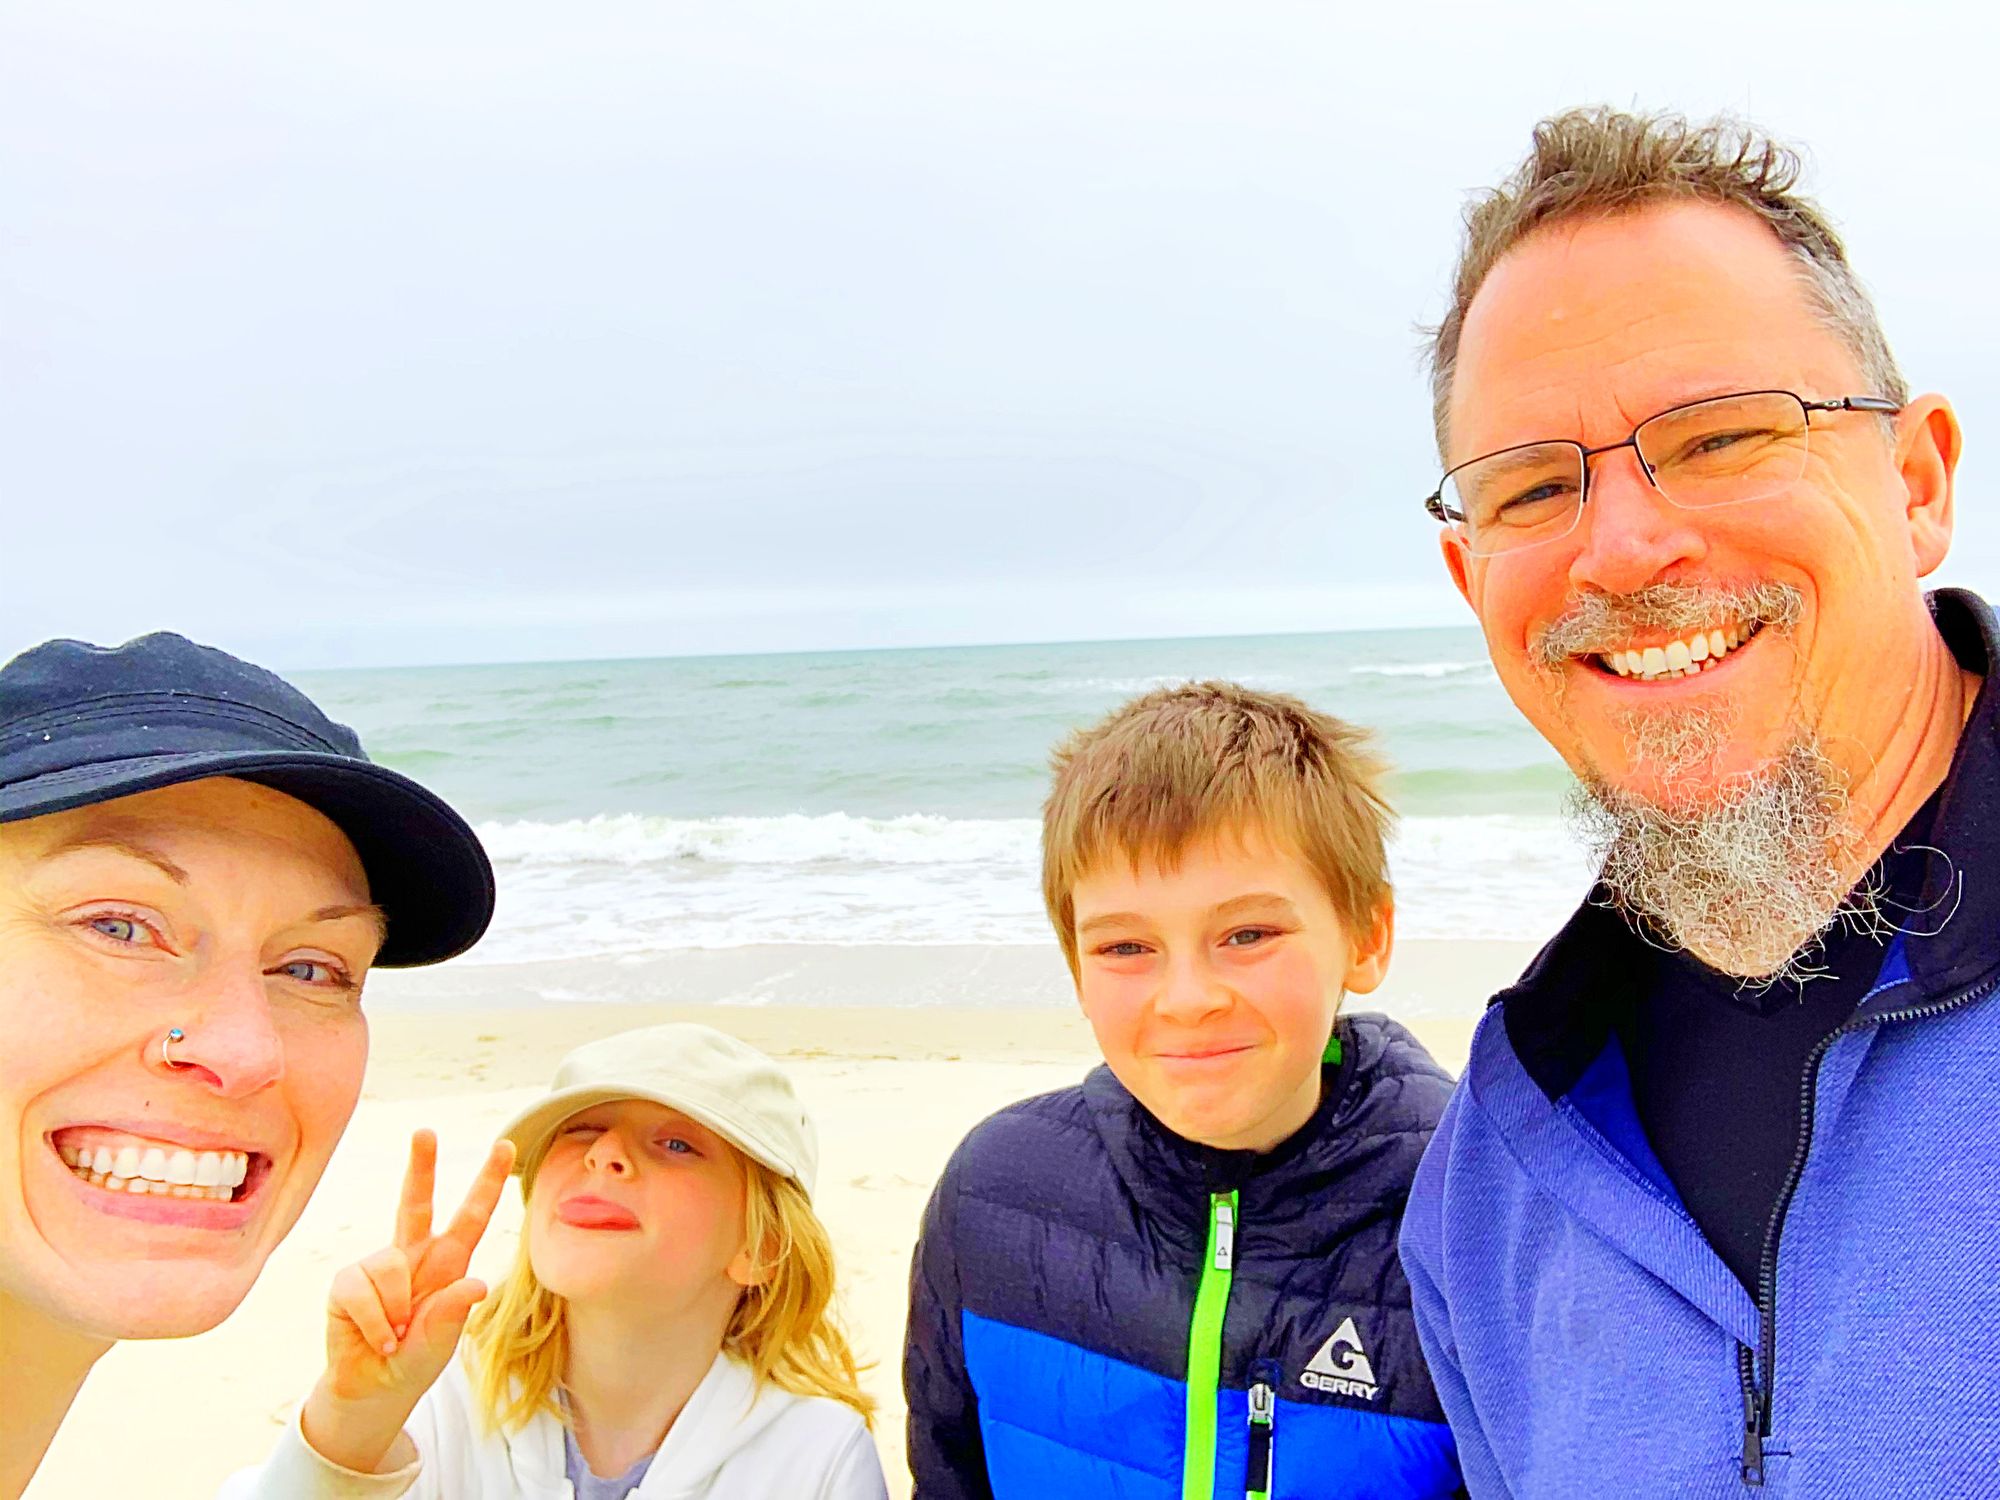
The image above is my family at the end of 2019, just a few months before our lives were completely turned upside down by covid. That is my husband, Dustin, whose long and painful journey with long-covid started back in March of 2020, (back when supposedly only 2 people in the metro Atlanta area, where we live, had covid. Boy, did we get a twisted story from the media!) when got our first infection. Doctors have no idea whatsoever why covid has affected him the way it has, but since the very first infection, he has never recovered and has remained incredibly ill in ways that we still, over 2.5 years later, cannot comprehend.
Our second infection was in December of 2020, after which his long-covid got even worse. And then in 2021, after two doses of the Pfizer vaccine, Dustin became completely disabled. We were never anti-vaxxers. We were waiting impatiently for the vaccine back in 2020, because we were so afraid of getting sick again, knowing how much the virus affects Dustin. I never would have imagined the vaccine would make him INFINITELY worse. And STILL no one knows why. In fact, we had been told that there was good cause to believe that the vaccine could HELP him. Unfortunately, that was not the case.
It has been well over a year since the vaccine, and he is still completely unable to do any kind of physical activity. He cannot even sit upright for more than a few minutes at a time, because the muscles in his body can either not produce energy or cannot utilize the energy his body provides. And the physical ailments would honestly not be as big of a deal if it were not also for the neurological impairment.
Dustin is an ivy league physics PhD. And about 95% of the time, his brain now refuses to function at even 30% what it had before the virus. It is heart-breaking to say the least. And this is all just the extremely short version of the story.
Why am I telling you this? I want you to know how important this dataset is to me. In November of 2020, we decided for an early Christmas gift that year, we would get him an Apple Watch so he could keep track of his physical condition more accurately, and maybe, JUST maybe, we could find trends that help us understand what on earth is going on with him. He is a scientist after all, and we have always approached this illness from an analytical perspective. 2 years later, neither medicine, nor the the data has really helped us much. But now that I am so deeply entrenched in my love for data science, I decided to extract all the info from his Apple devices and see if I can find anything that points to ANY kind of answer.
With two years worth of data, there was still very little that I could gain from my findings aside from what we already know to be true. BUT it definitely confirmed for us that the aspects we have mentioned to numerous medical professionals and other people in our lives that have brought us only looks of confusion and scoffing. Well, the data confirms that we are not silly for noting these peculiarities in our observations. And honestly, that is enough for me to consider this whole project a success. More on those confirmations later!
Here begins my analytical journey via data science into the illness that has rocked my family to its core.
The Data:
When I first extracted the data from the Apple devices, I was floored by the fact that EVERY SINGLE FEATURE is its own file. And that would not be so bad, except for how spotty the data was. It took me two days just to pre-process the data to the point to of being able to merge it all into one dataframe. But honestly, I enjoyed the work. I learned a lot from it!
I broke the project up into 4 different Jupyter Notebooks for ease and to keep everything nice and clean. This is the first notebook, which contains the original import of the data and the initial pre-processing:
⇨ Part 1: Data Pre-Processing and Feature Engineering Jupyter Notebook - PDF
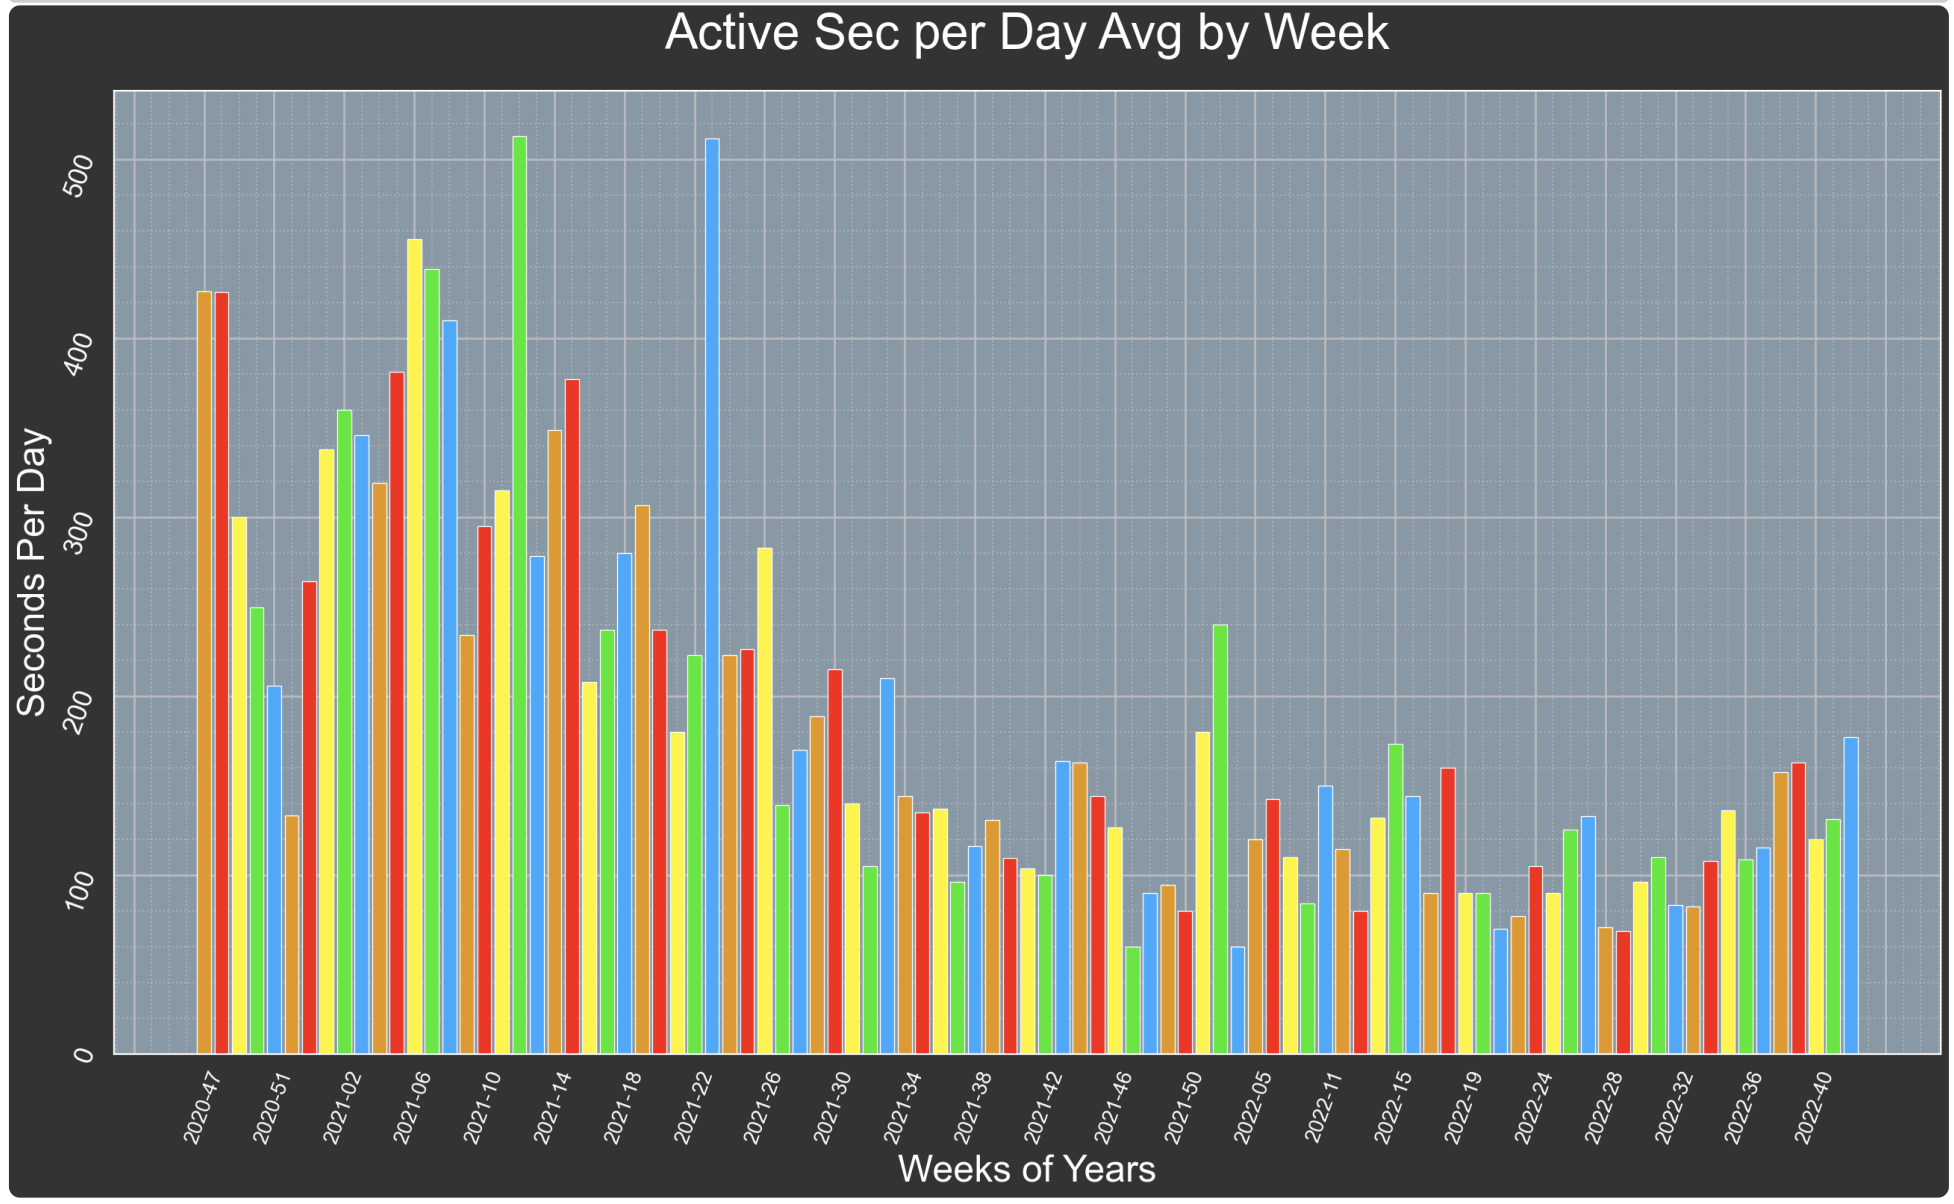
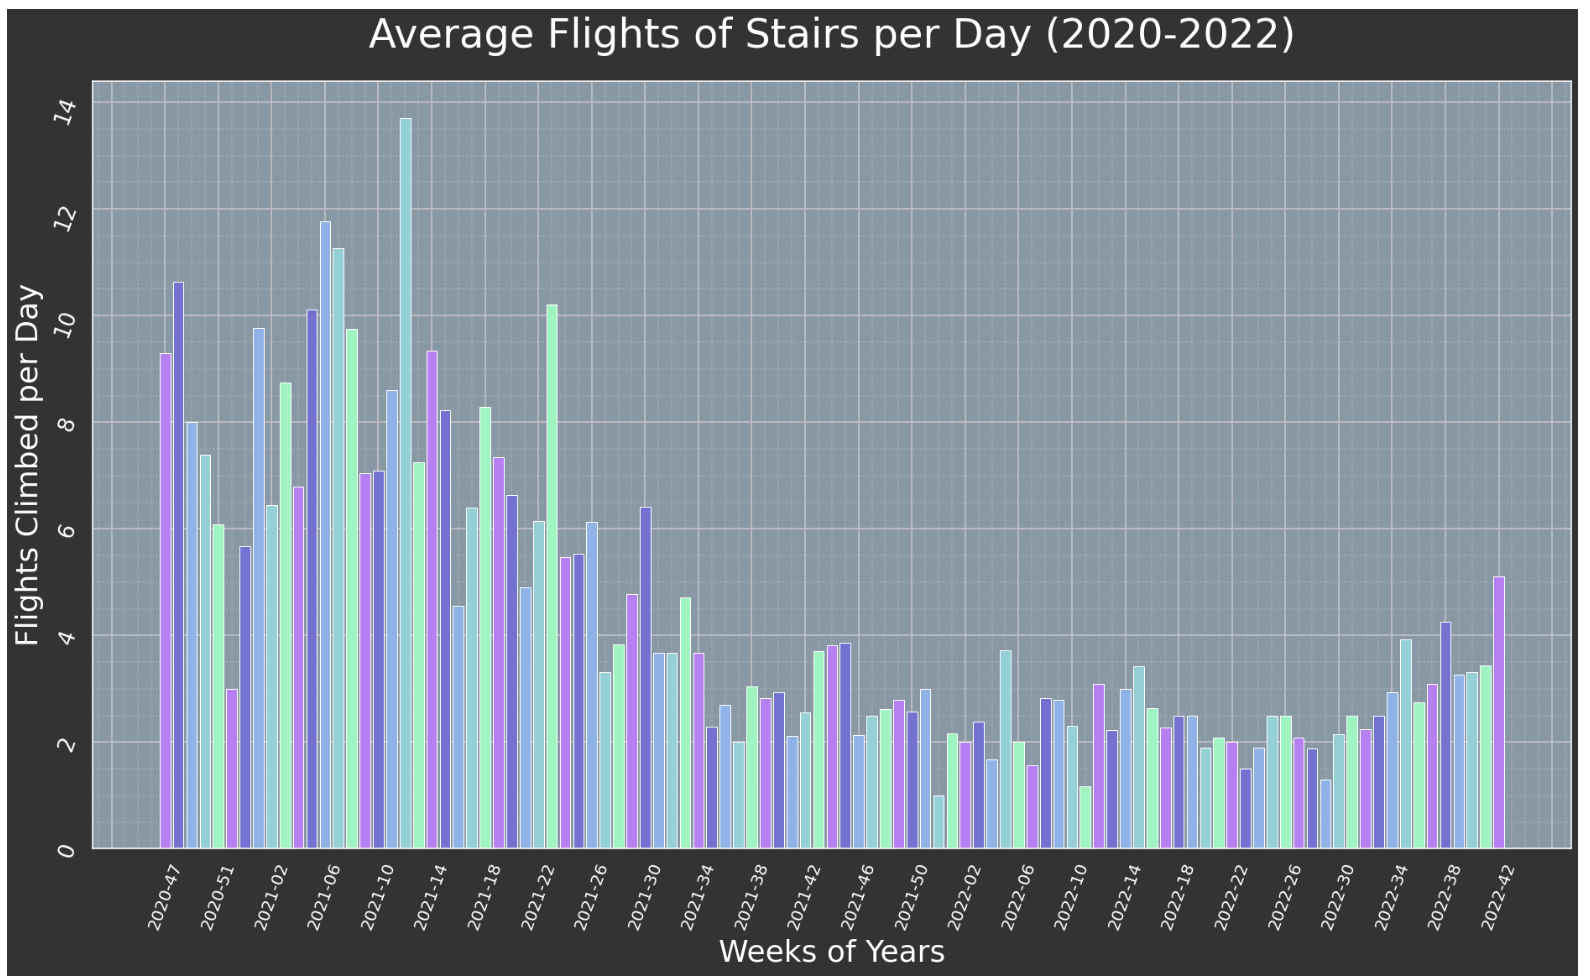
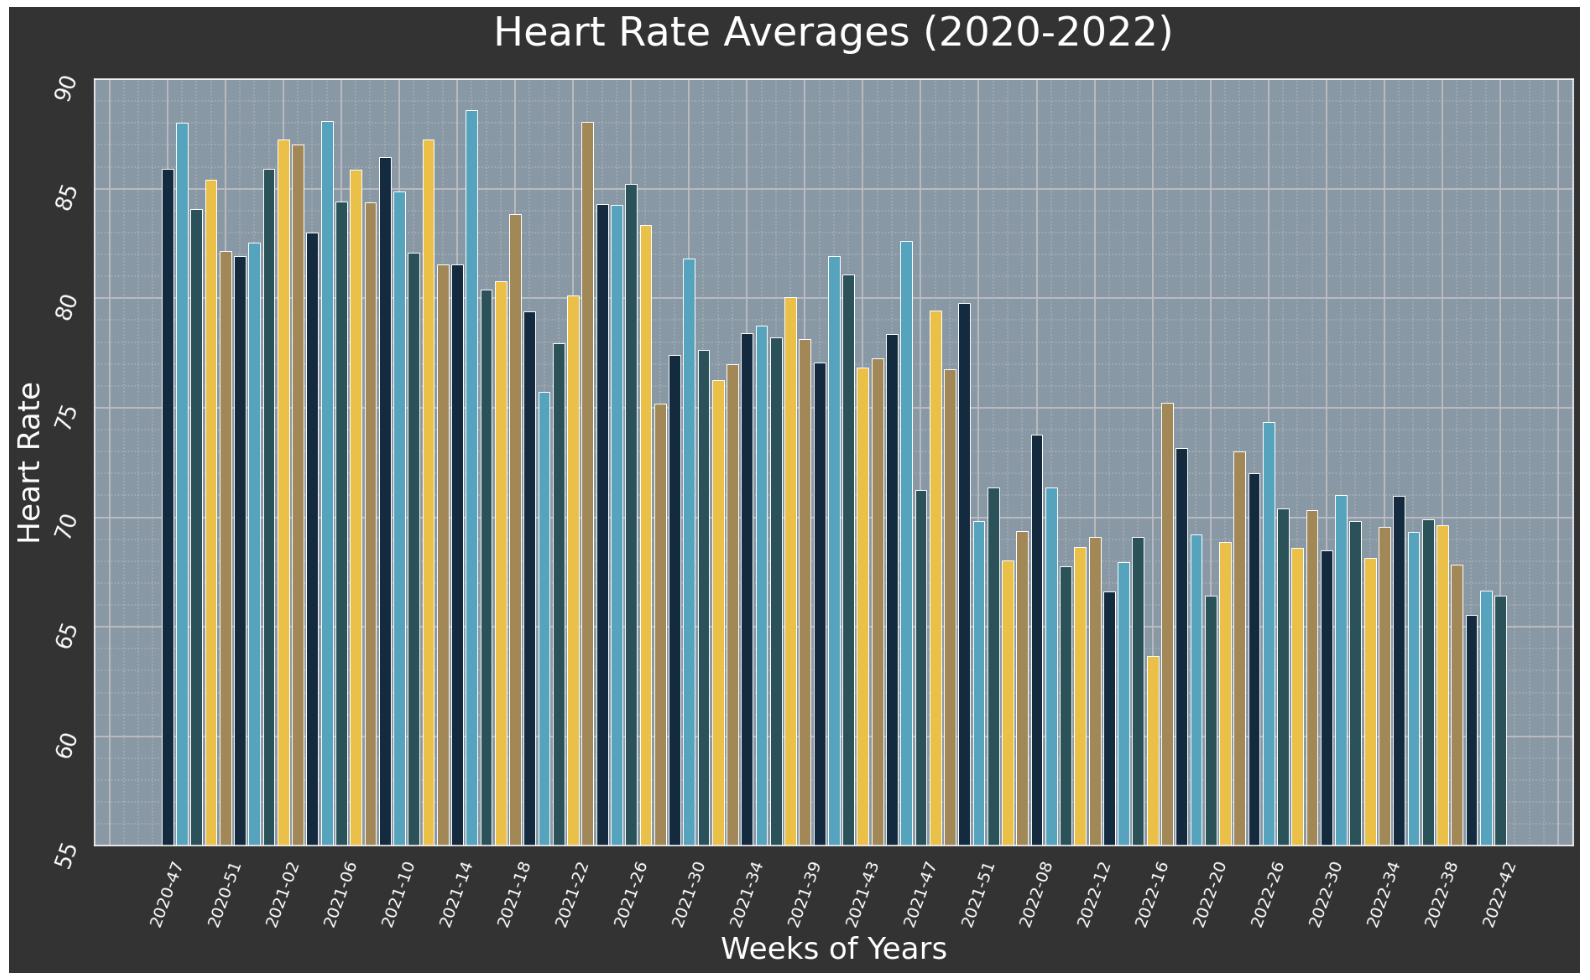
The Features:
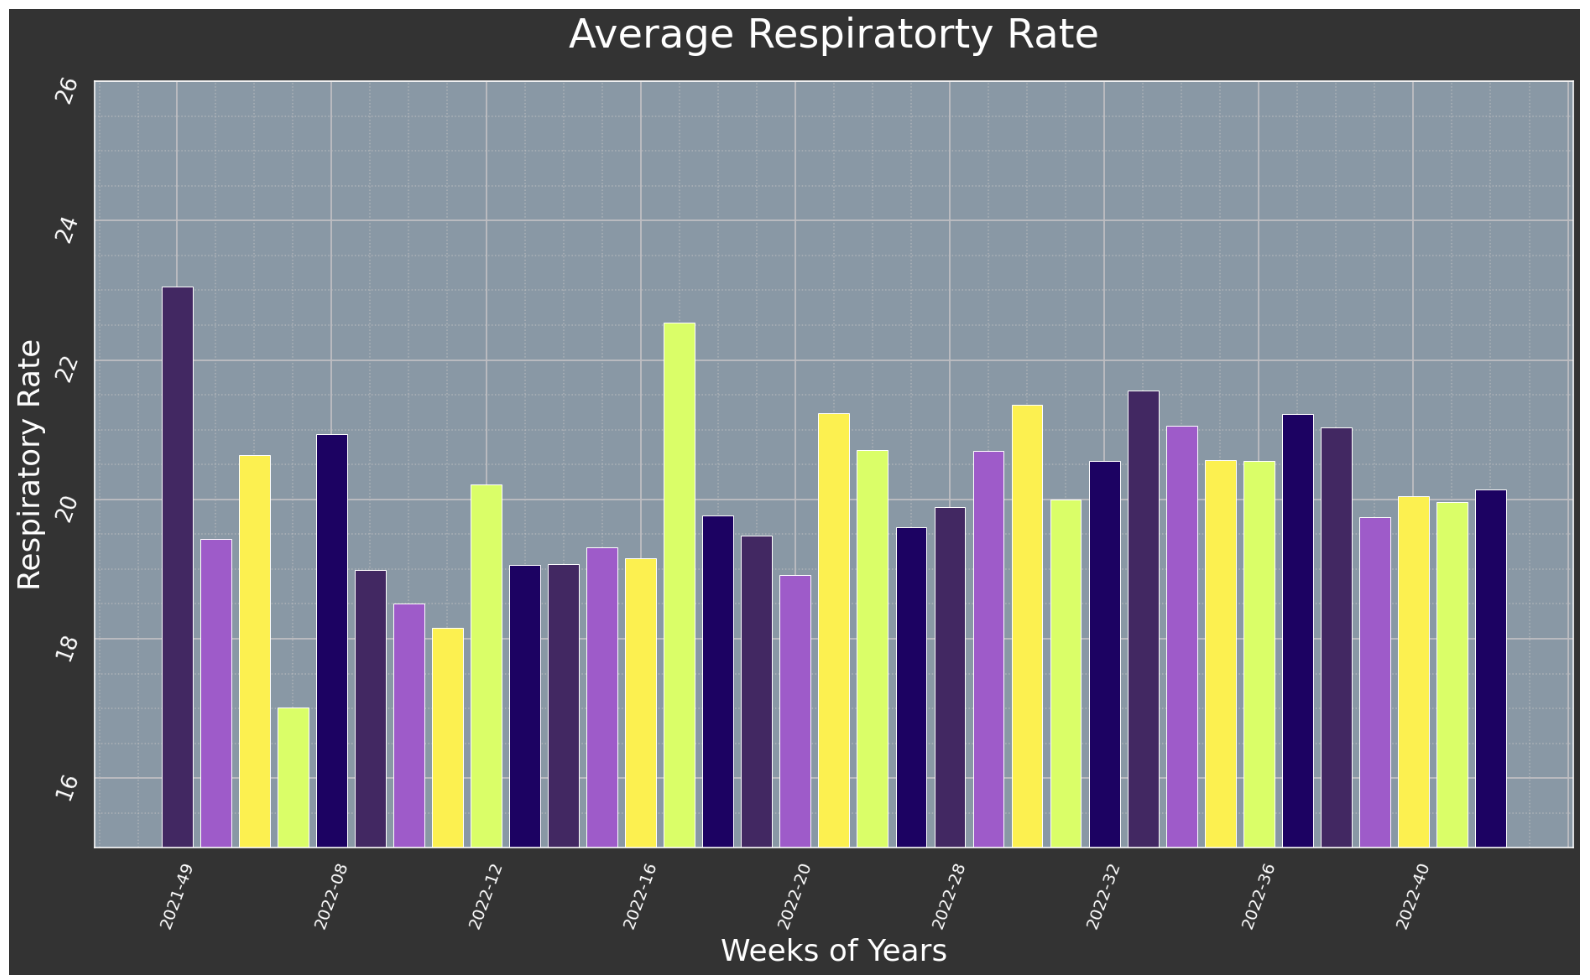
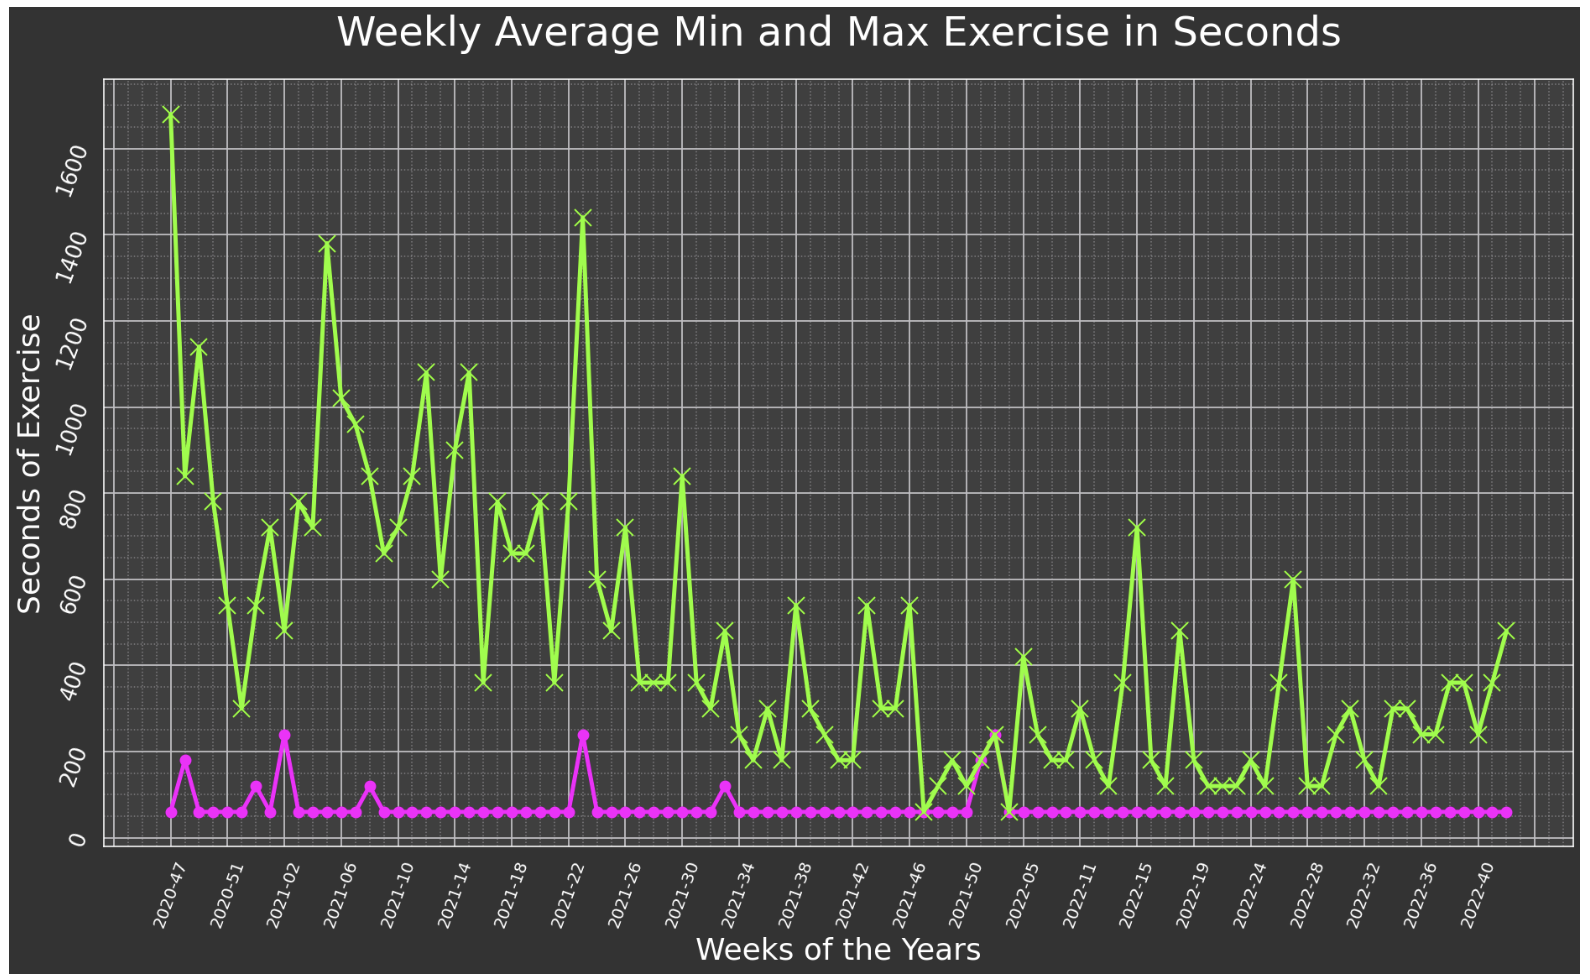
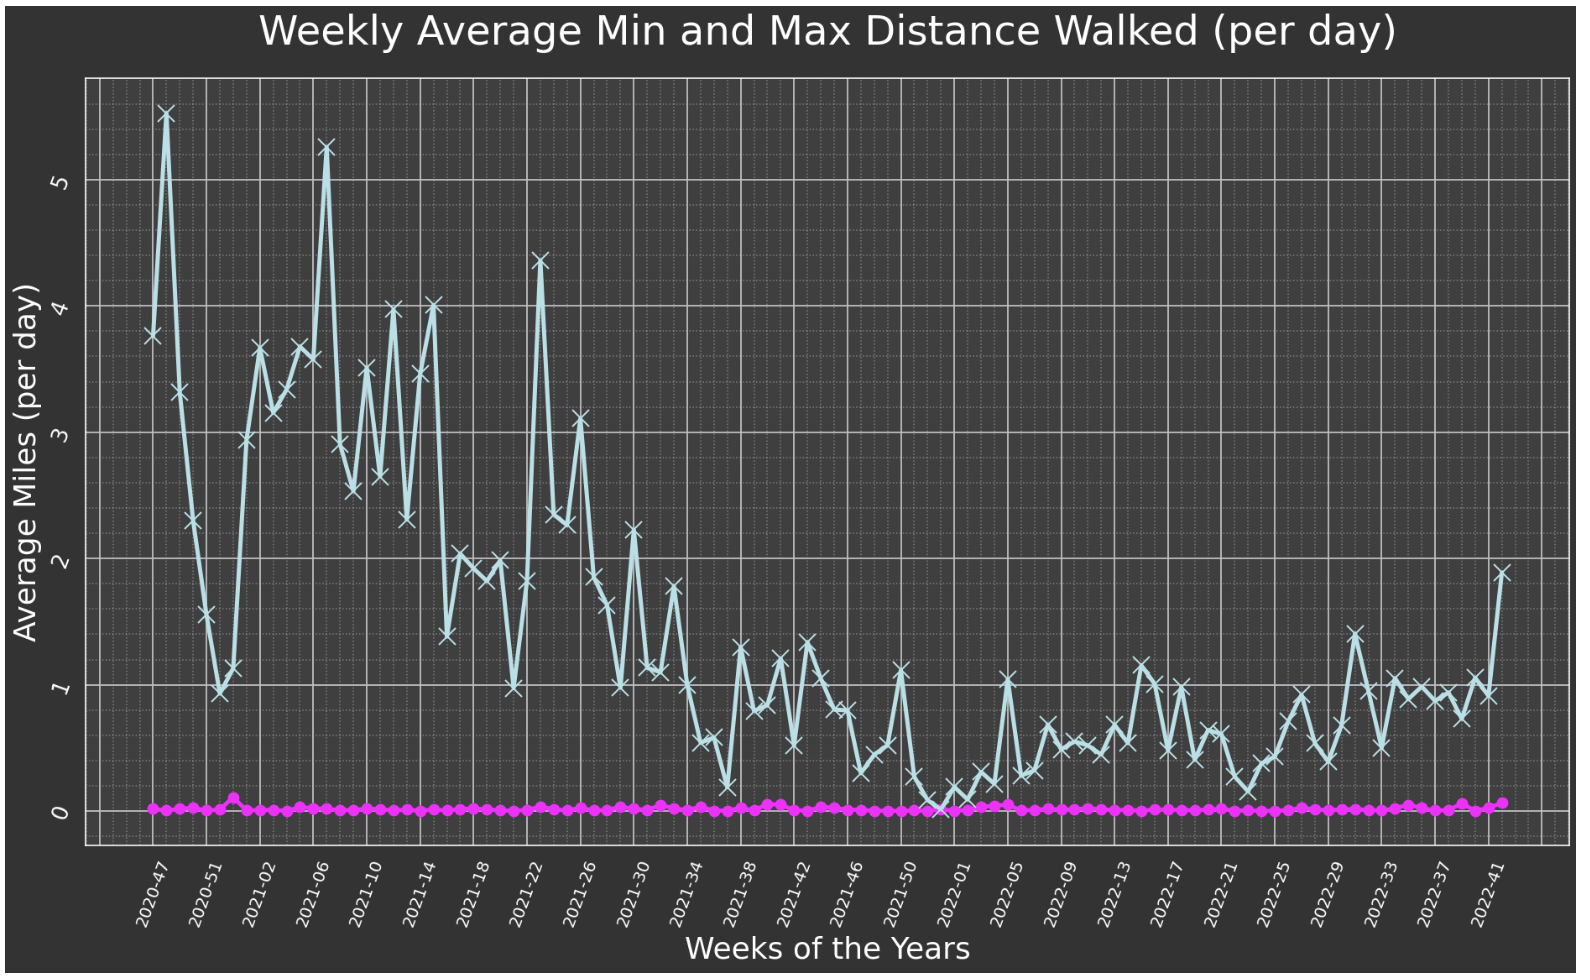
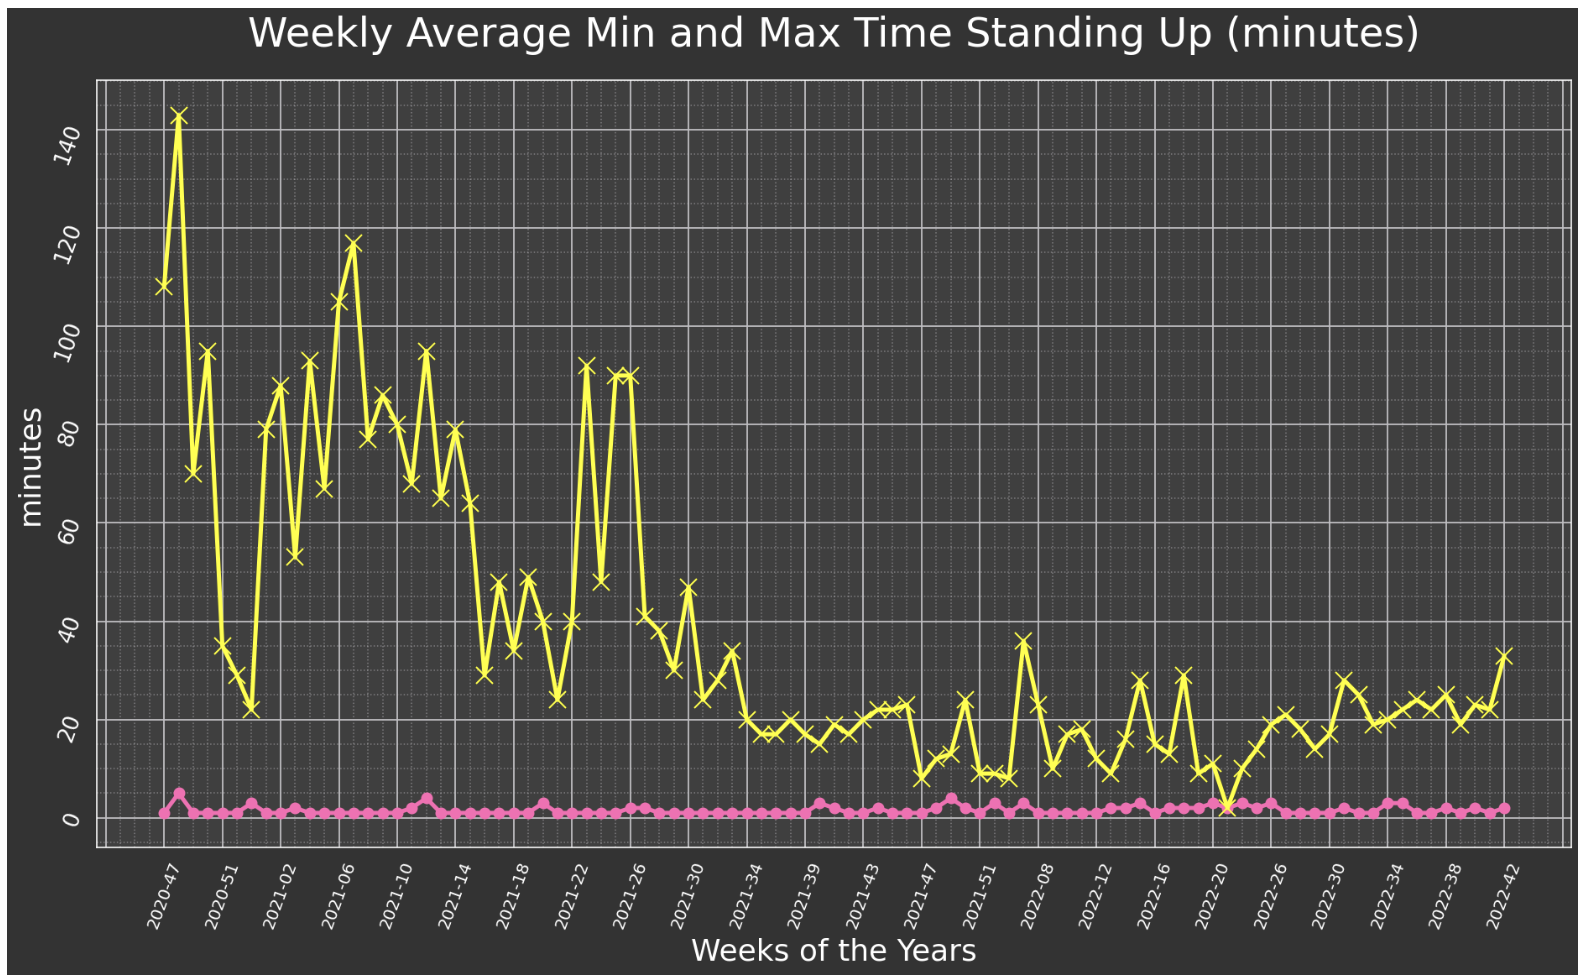
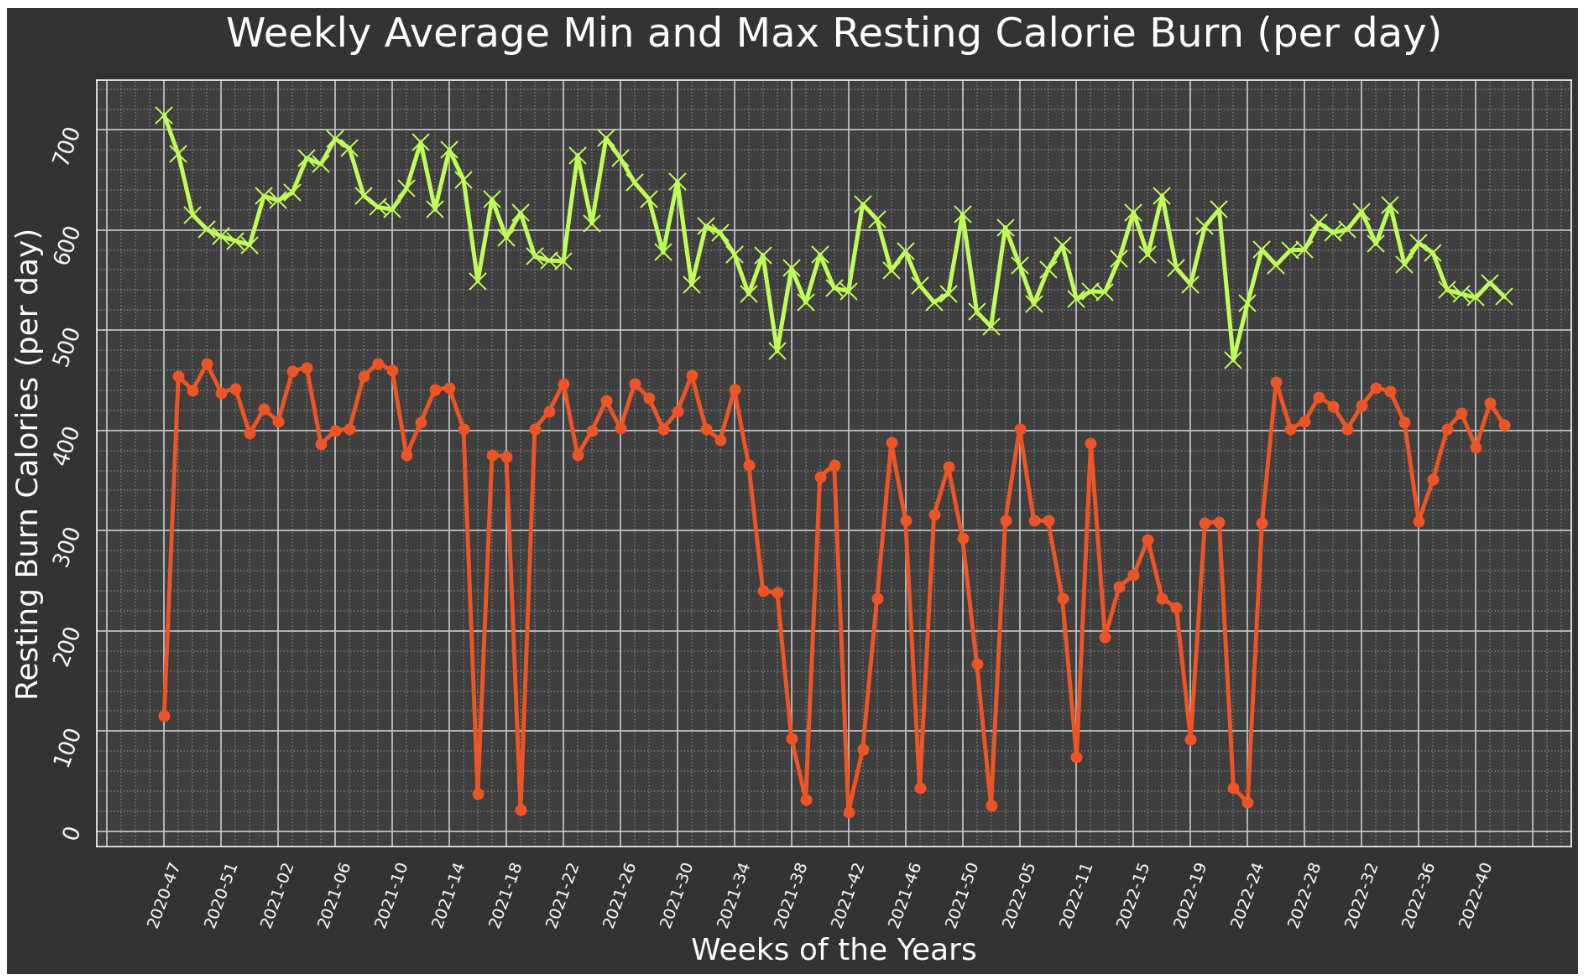
The next step I took was to look at each of the main features from the original data and plot them over time to see how the trends presented. Sure enough, the plotting showed a steep decline just following the vaccine, which is when Dustin went from working full-time, even though he was already incredibly ill and had been for a year and a half or so, to not being able to even take care of himself. (See the visualization plots below for details.)
⇨ Part 2: Individual Dataframes Visualized Before Merging - Jupyter Notebook - PDF
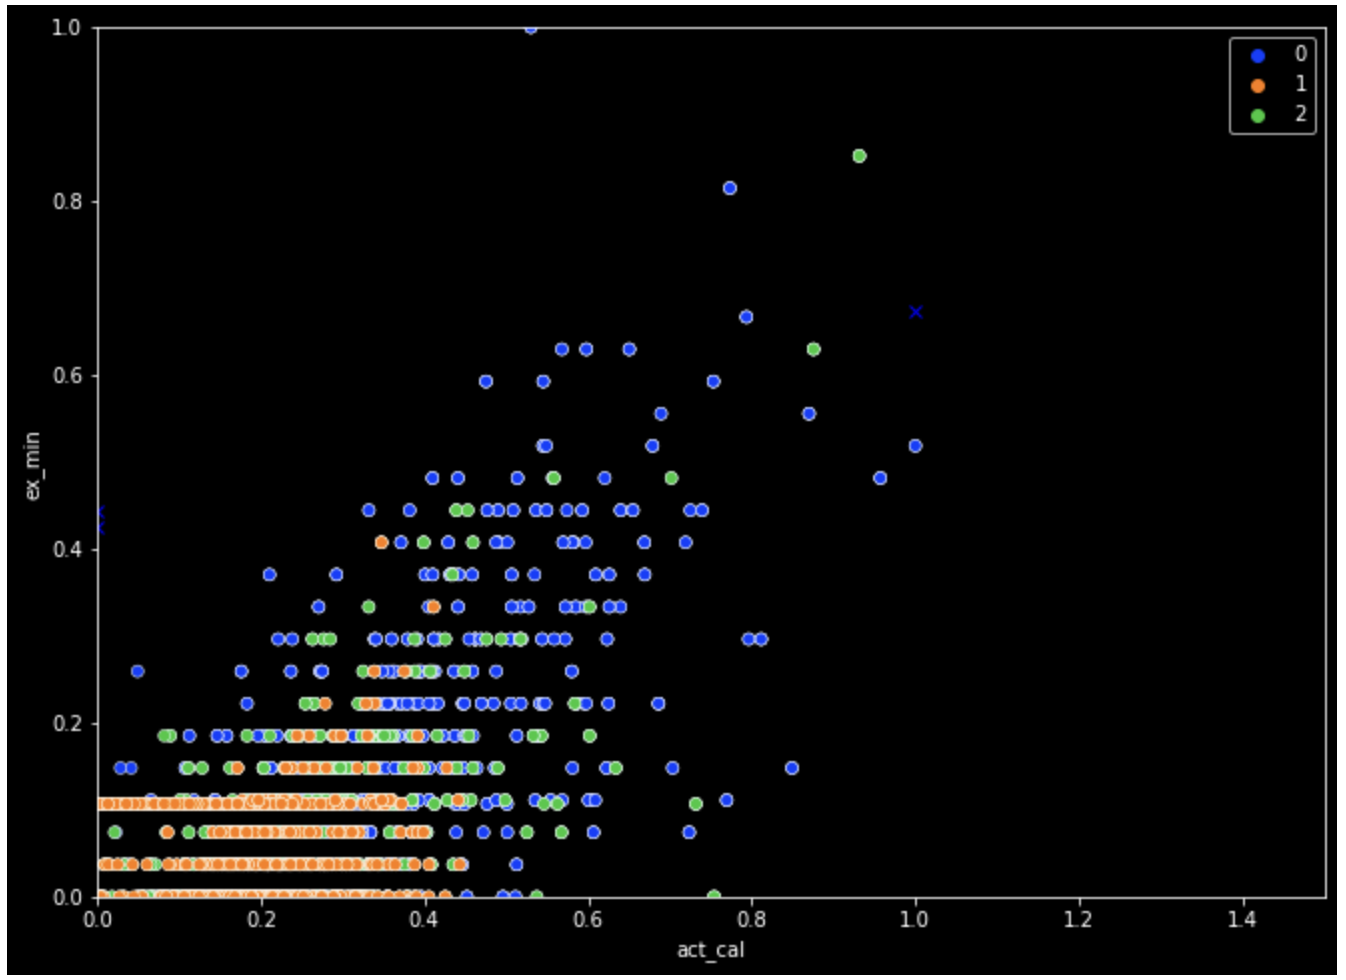
Clustering Attempts:
Next, I worked with the data and tried some unsupervised machine learning clustering, just to see what it might show me from the data.
⇨ Part 3: Preliminary Plotting and Data Investigation - Jupyter Notebook - PDF
XGBoost Regressor Model:
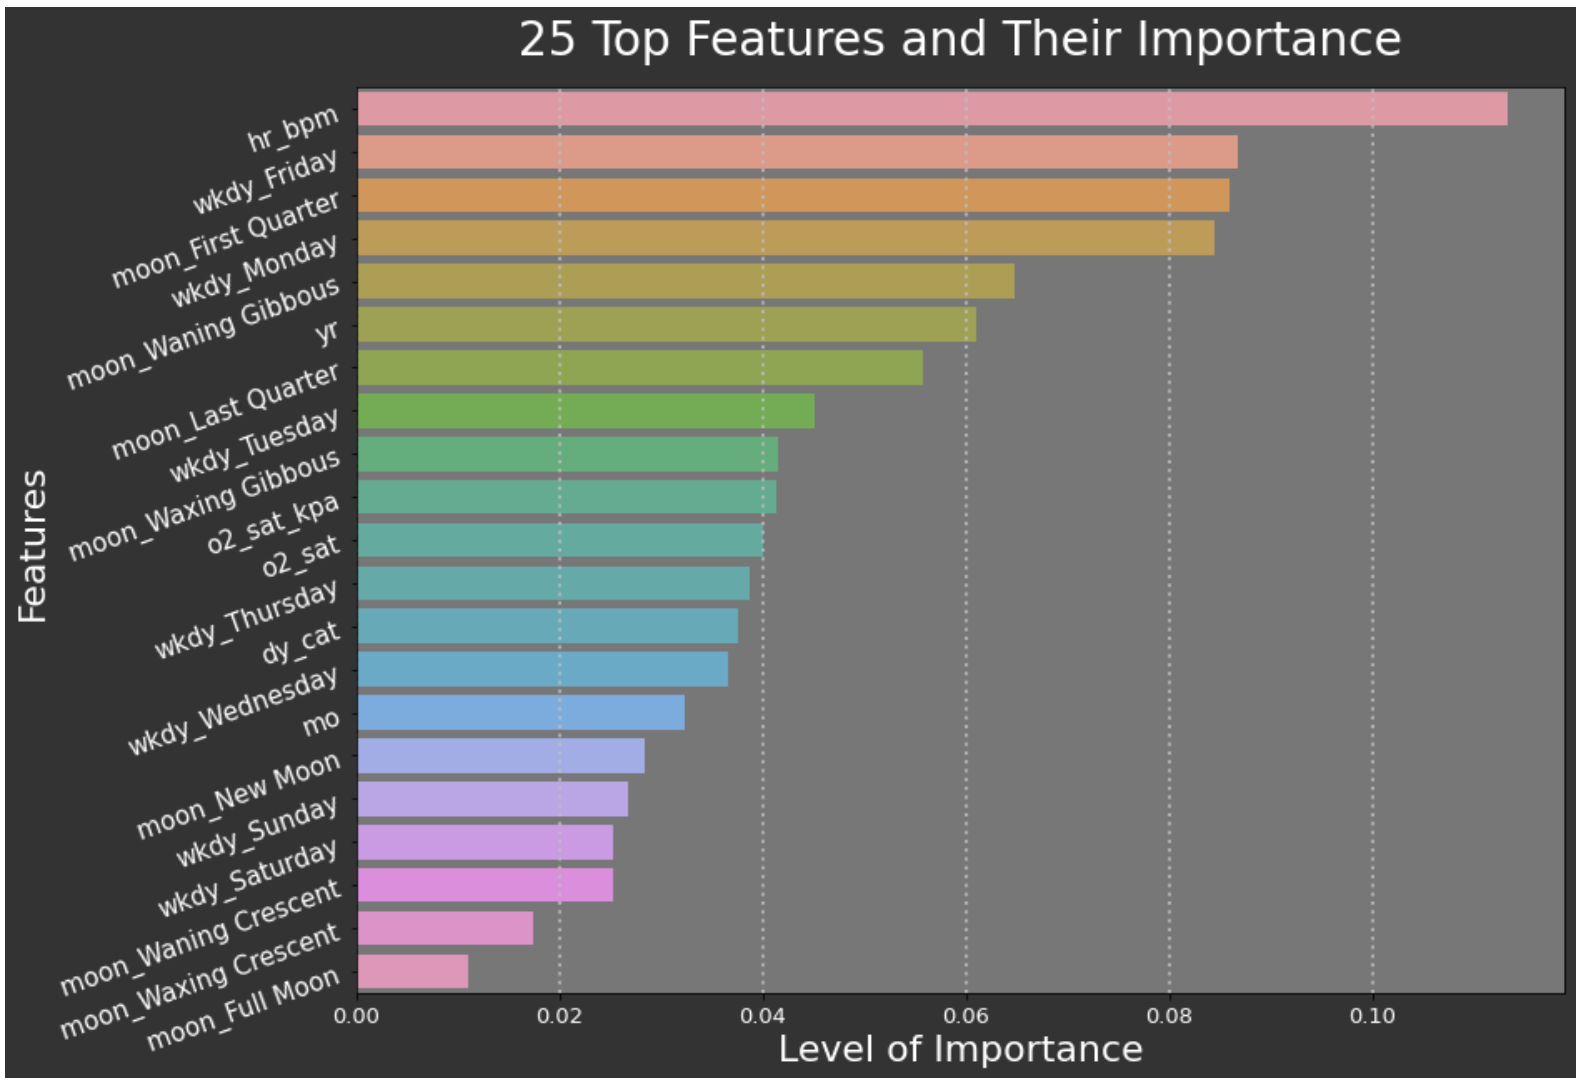
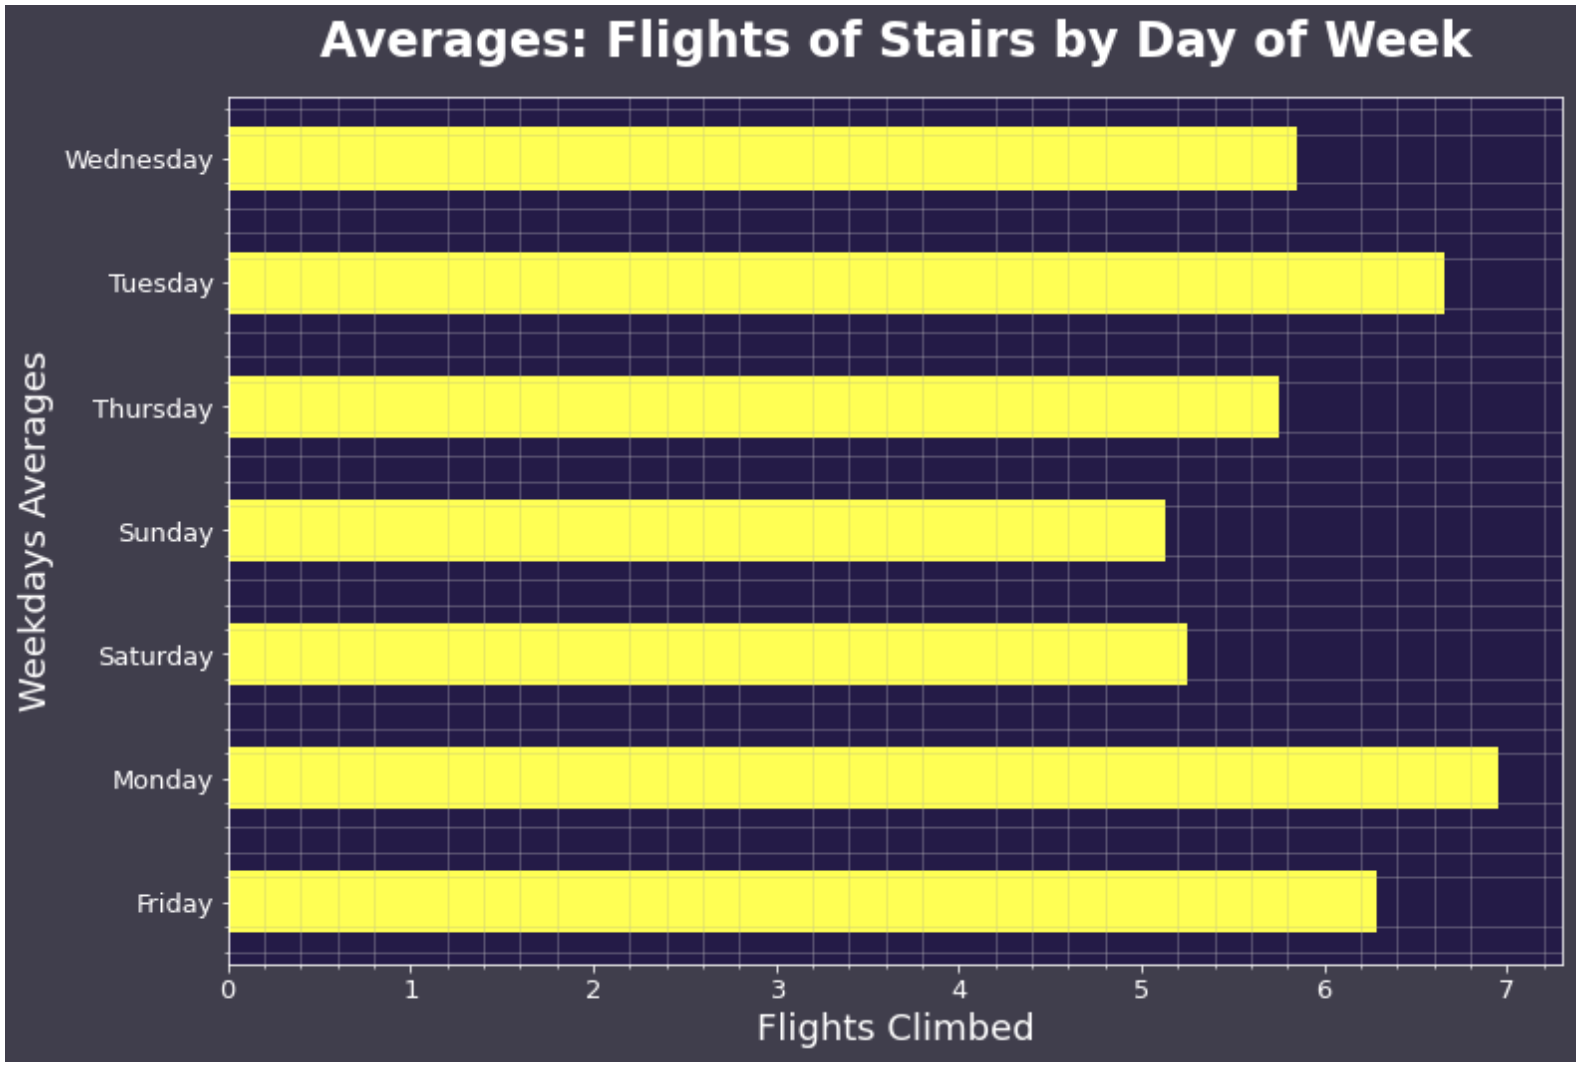
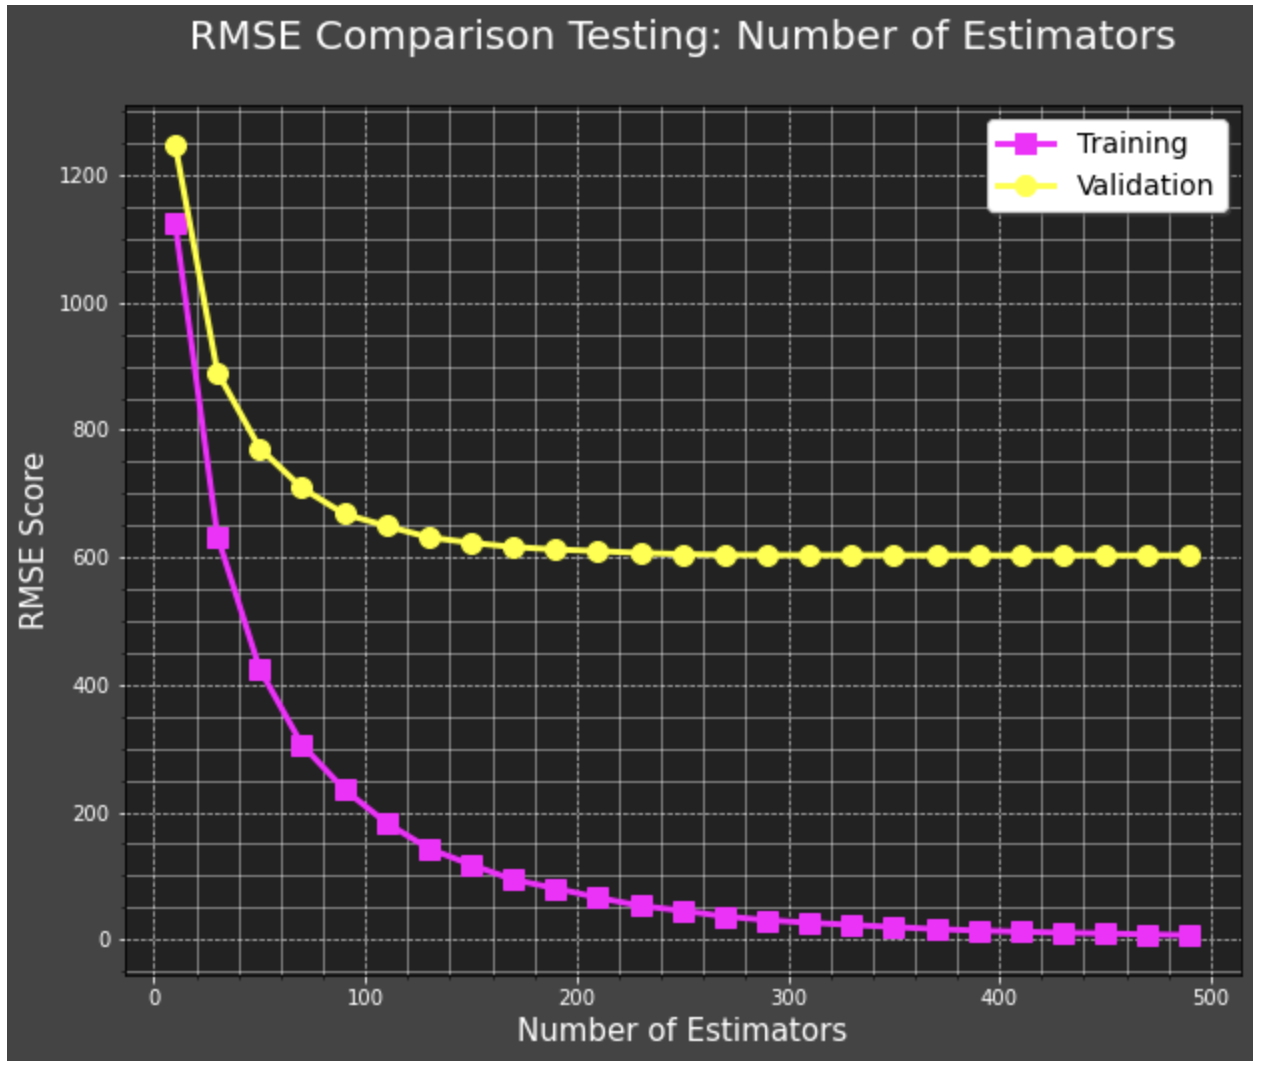
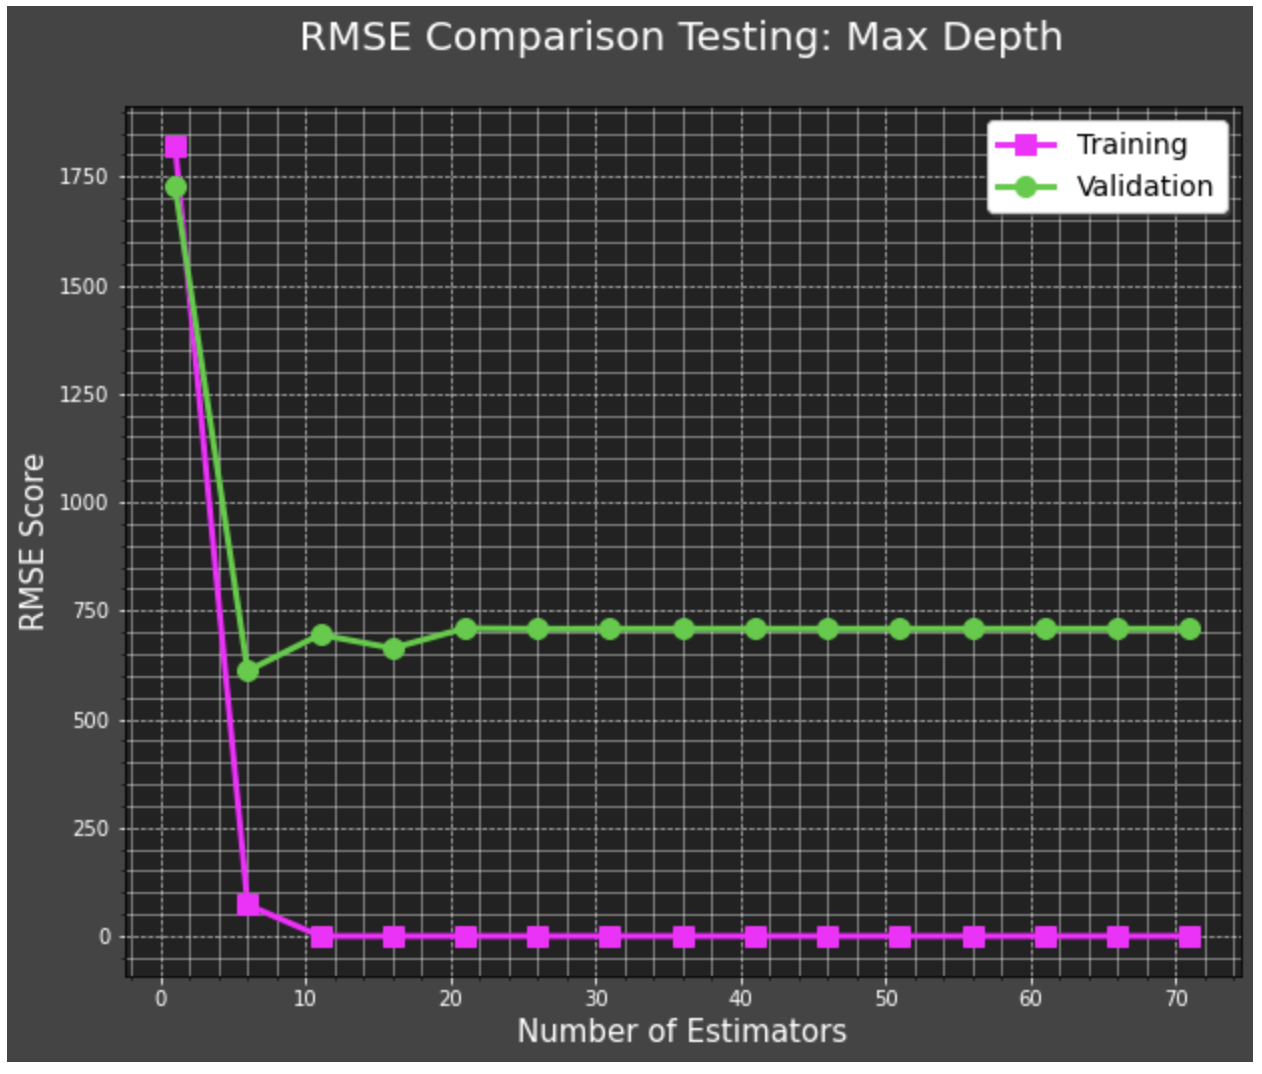
And finally, I worked with an XGBoost Regressor model to put it all together. For the targets, I combined the features that would seem to exhibit the output of Dustin's physical abilities at any given time, such as his active caloric burn, flights of stairs climbed, steps take per day, etc.
The most striking realization from all of this was that what we noticed about how his illness is somehow correlated to the phases of the moon actually showed up in the data. In fact, Dustin has always said that the first quarter is when he tends to feel as good as he can since he became ill. And while that might not seem like much of a big deal, to the two of us who have been saying for 2.5 years, that there is a clearly discernable correlation between this illness and whatever it is that the moon is doing to his body only to be met with blank stares or laughter, this means a lot to us!
⇨ Part 4: XGBoost Regressor Model - Jupyter Notebook - PDF
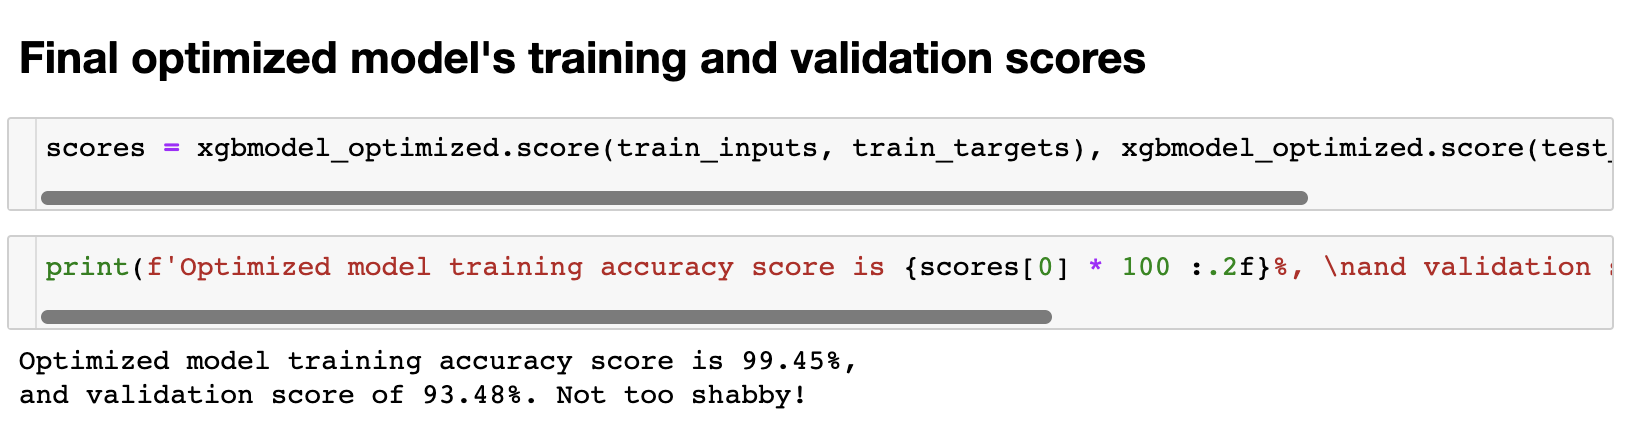
And how did my optimized model perform? Not too shabby! 93% accuracy on my testing/validation data! This is the accuracy of the model at predicting the physical activity level at any given subsection of any given day based on the variables used. Days are broken up into 4 sections: middle of the night, morning, afternoon, and evening. At the bottom of this post, I have included all the code for the machine learning model section of this project.
Next Steps:
This project is by no means conclusive, nor is it finished. I was a professional opera singer and voice teacher when this data collection began. The new me, the data scientist, desperately wishes I had known how fruitful far more data would be, data such as what supplements and prescriptions Dustin was taking, dosages, relative ratings of how he was feeling at least 2 to 3 times every single one of the 700+ days we have documented, etc. So now, we are setting up a data collection plan where we will track those and many more variables as well. I am determined to find a way to help him, and others if I can! One of the greatest frustrations throughout this experience, aside from the pain and suffering my husband has gone through, as well as that which I and my children have faced, is the sheer lack of knowledge as well as acknowledgment from the medical community.
Medicine's focus is primarily on pulmonary and cardiovascular issues associated with long-covid, but what my husband and many others face is a chronic fatigue syndrome worse than any other illness has ever created, neurological issues that strongly resemble Alzheimer's, and a whole host of other issues that greatly degrade their quality of life. And until these issues are faced in a real way through a joint effort on the part of the greater medical community, millions of people will be suffering in ways that those of us who are so lucky to not face their fate will never understand. Truly, I have lived side-by-side with this illness for years, and I am surprised every day to find that there is yet another issue that my husband has been suffering through and keeping from me just because he knows how much it hurts me to watch him hurt. This is something we must all address. And we must do it together. They deserve that. Thank you.
Visualizations:


The following contains part 4 of this project, which is the machine learning model, XGBoost Regressor, that I used and got to an accuracy of 93.48% on predicting the physical ability level based on the variables included. The previous 3 sections can be viewed in PDF format above.