📈 Alpha Vantage API Overview


I spent some time recently working with the Alpha Vantage API for financial data, and while the experience left me slightly underwhelmed, there were still some worthwhile aspects of the API that I feel deserve acknowledgement.
The first thing I really appreciate about Alpha Vantage is the people. When I first got my API key (yes, you need an API key, unlike Yahoo Finance) and performed my first call, I got an error that I had to have a premium account to make that call. So I contacted them and let them know that I really need to be able to make the simplest call with my free account, otherwise there is really no reason to have a free account level. The people who helped me were incredibly quick and helpful. They made sure I had access immediately. And I truly appreciated that.
Alpha Vantage Online | alpha_vantage module
Here is a brief bullet-point description of what the API offers, the pros, and the cons to using Alpha Vantage.
Alpha Vantage offers:
- real-time and historical stock data
- foreign exchange and cryptocurrencies
- 50 technical indicators
- global coverage
- composed of a community of researchers, engineers, and business professionals
- a leading provider of financial data
Pros
- Free (5 calls per minute, 500 per day), and premium is available
- Large datasets for crypto, stocks, etc
- 50+ technical indicators (such as SMA, Bollinger Bands)
Cons
- Limited call requests
- API key needed, compared to yfinance that requires no key
- No high frequency or real time data
- No data for bonds, funds, indexes, or commodities
The Code: Embedded Jupyter | Interactive Jupyter | HTML
| Evan Marie 🌎: EvanMarie.com | EvanMarie@Proton.me | Linked In | GitHub | Hugging Face | Jovian.ai | CodeWars | TikTok | Discord ⇨ ✨ EvanMarie ✨#6114 | |
|---|
| Jump to: | Top | Getting Data | Splits & Dividends | The Datetime Index | Frequency & Intervals | Technical Indicators | Foreign Exchange | Cryptocurrencies | |
|---|
1. Getting Data
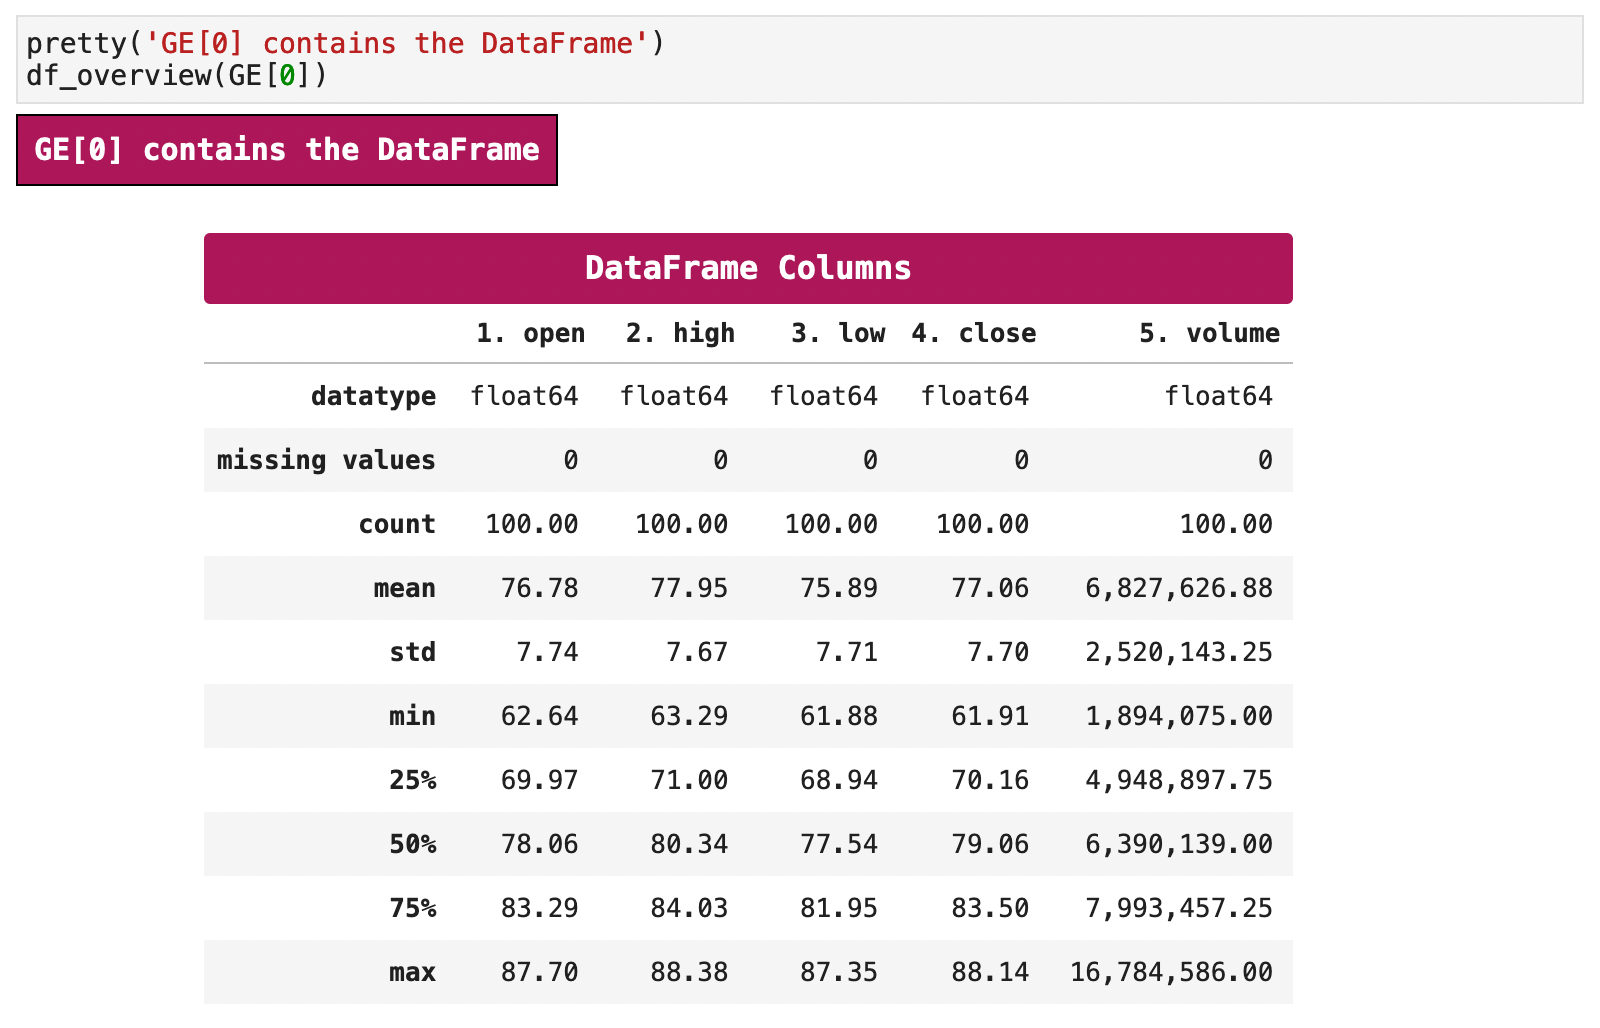
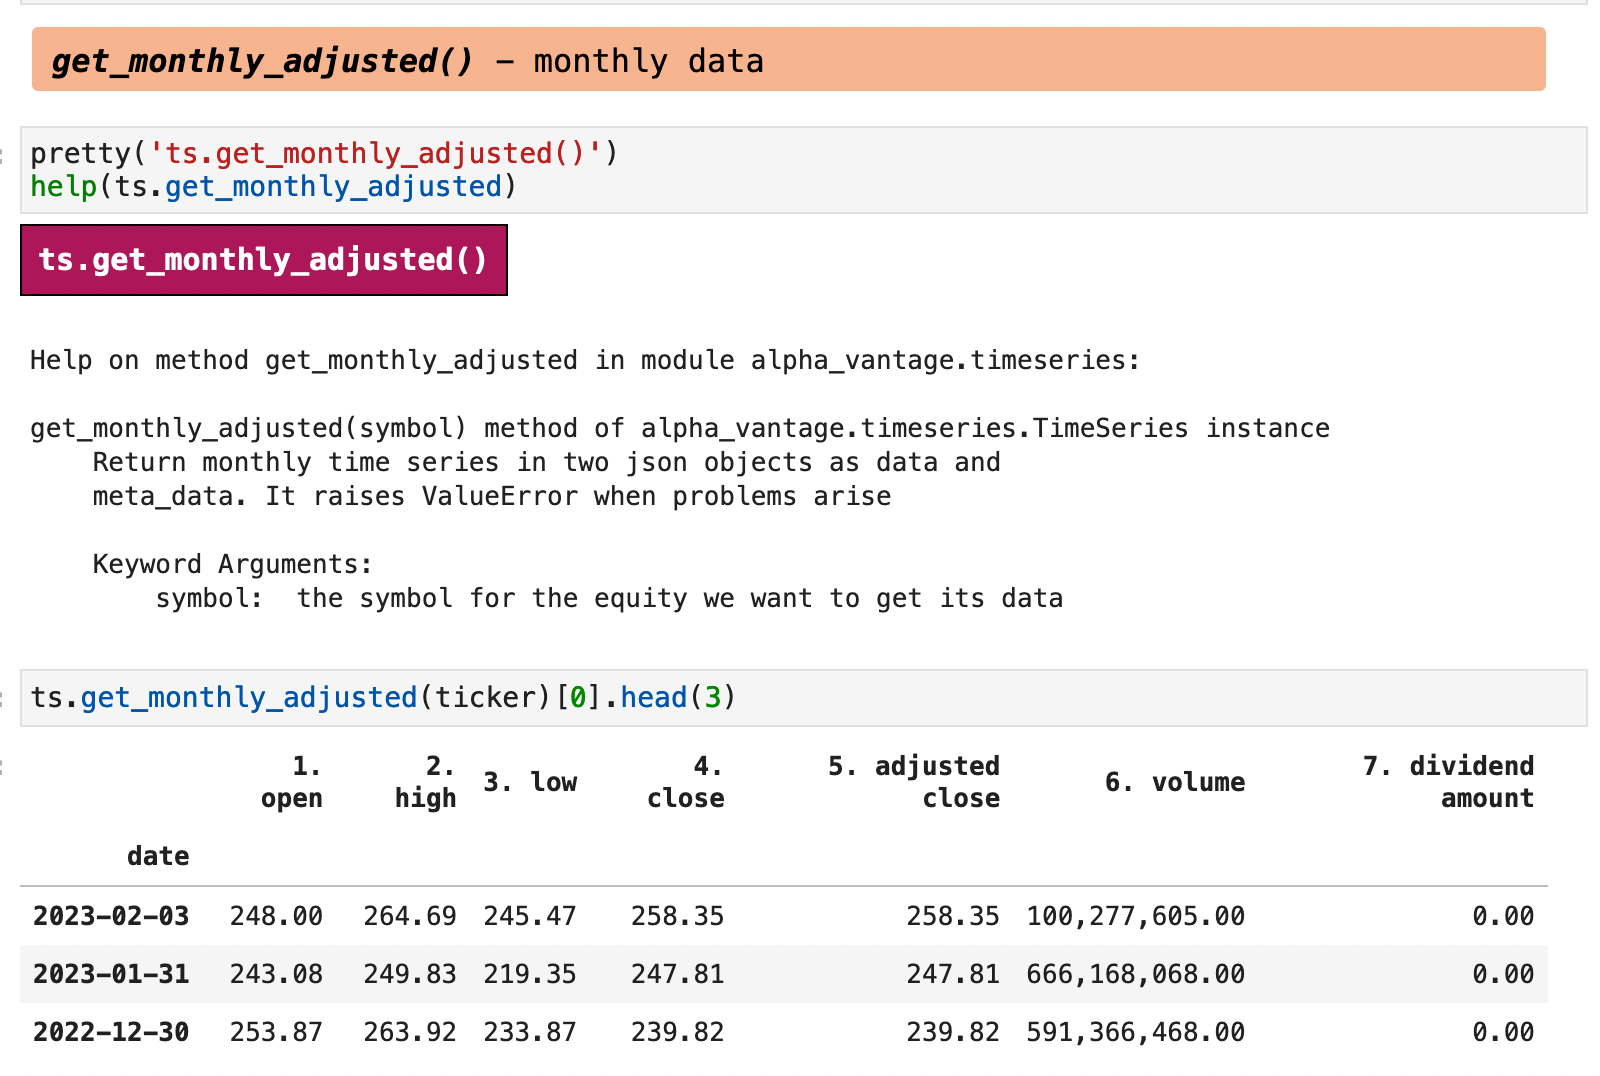
The API is simple enough to use, just like Yahoo Finance is working with the yfinance module. Each of the alpha_vantage library's modules are used by creating an object that is then used to query the API. For simple stock price calls, the TimeSeries() object is used.
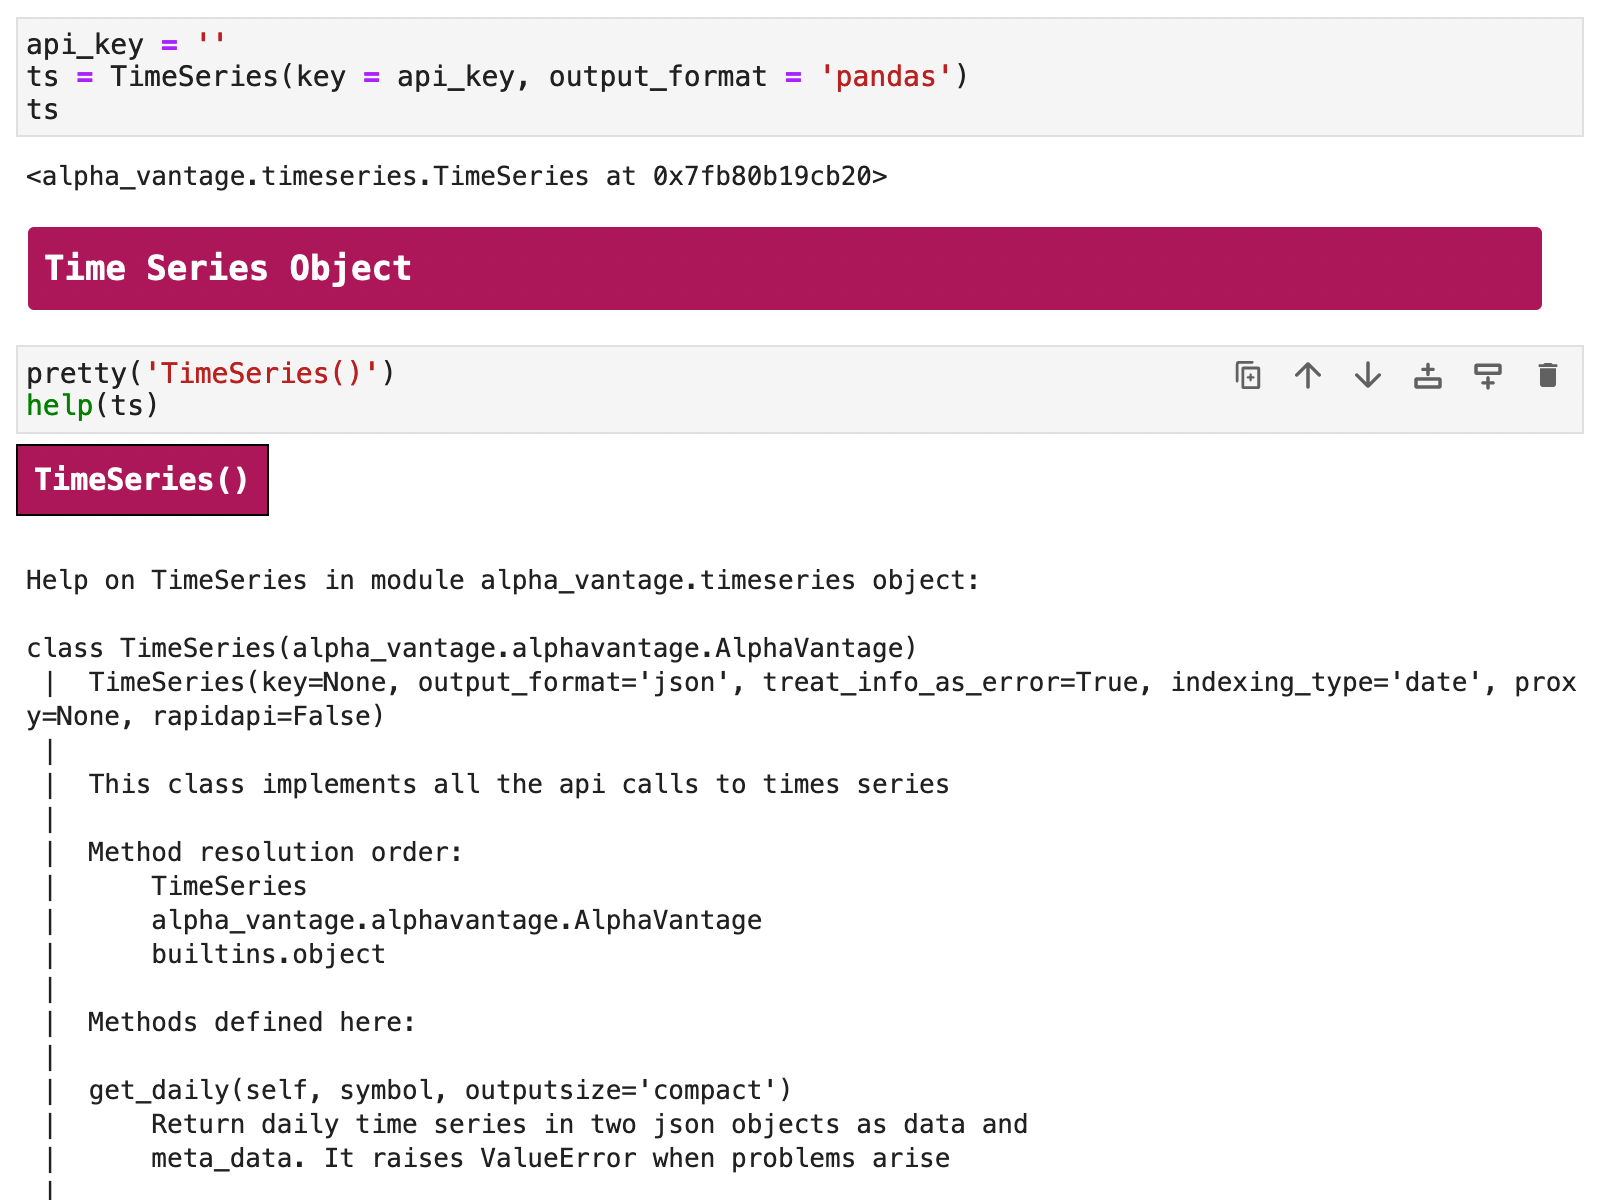
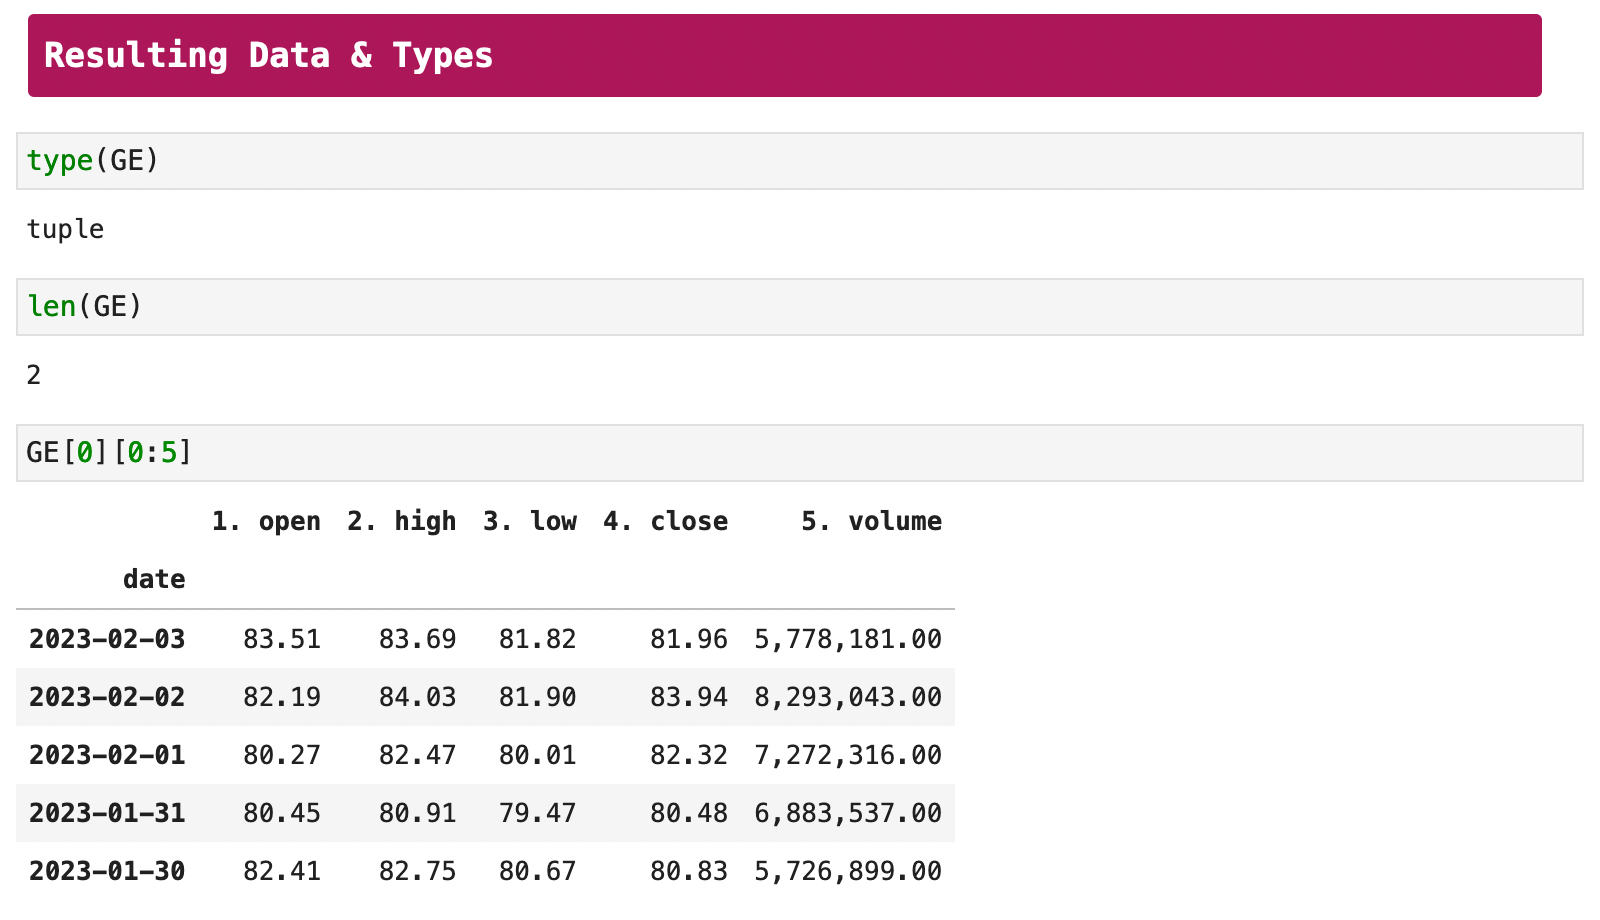
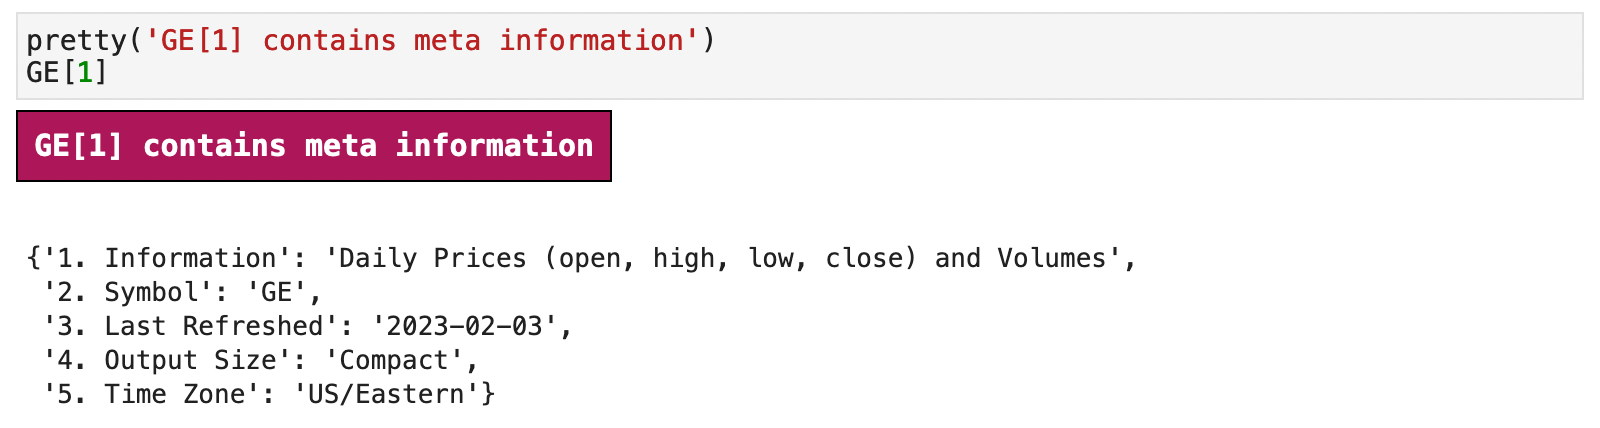
And this is when things got interesting. Whereas with Yahoo Finance and the yfinance library, data can be directly pulled in to Pandas as it comes in from the API, with Alpha Vantage, you get some extra meta data along with your call, which is actually rather nice. But it does require a little extra code and remembering which comes first, the data or the meta data.
In the following code, I have walk through the steps of showing how this works when querying Alpha Vantage. And this format is uniform across the board, from TimeSeries() to CryptoCurrencies().
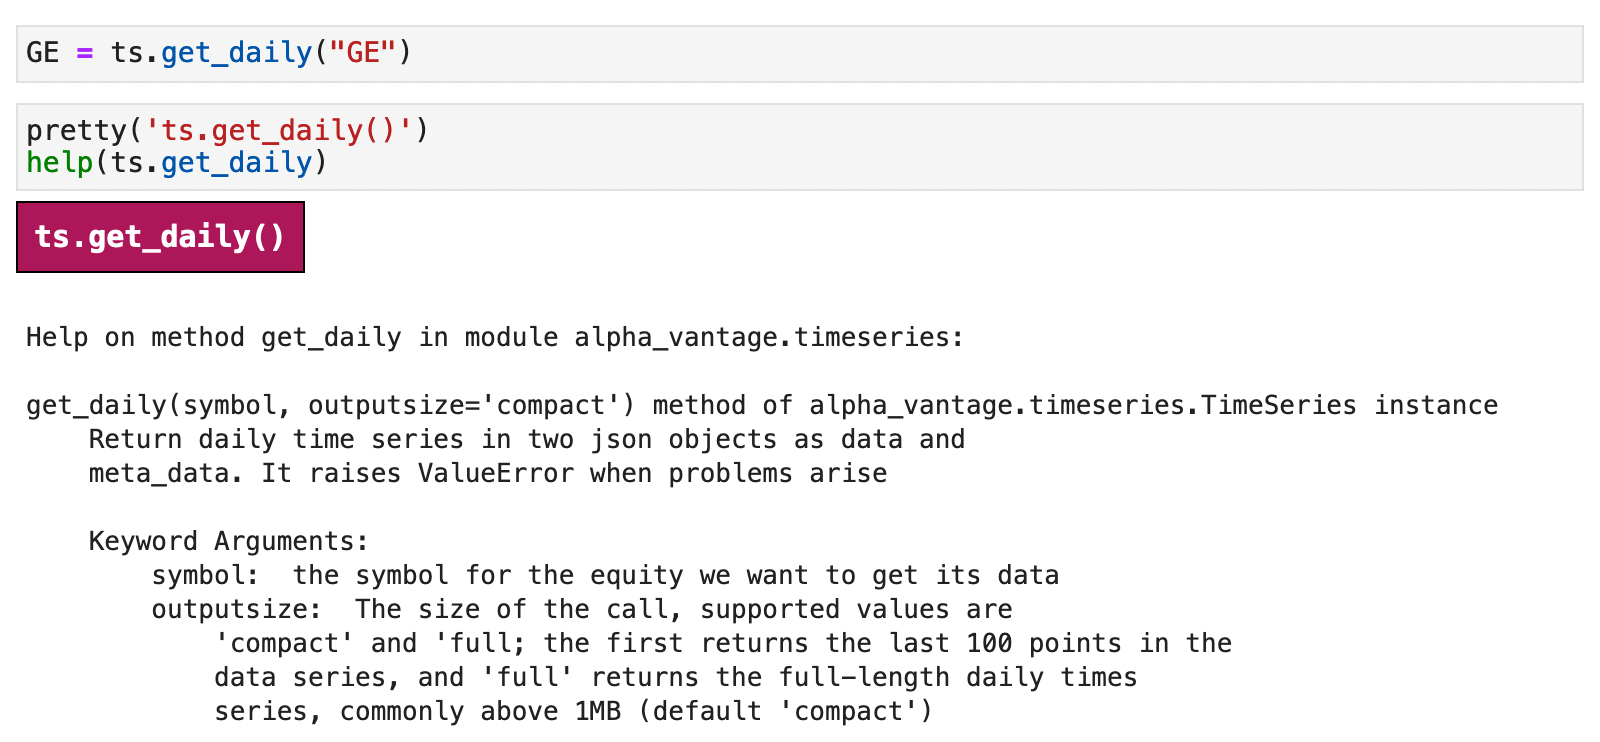
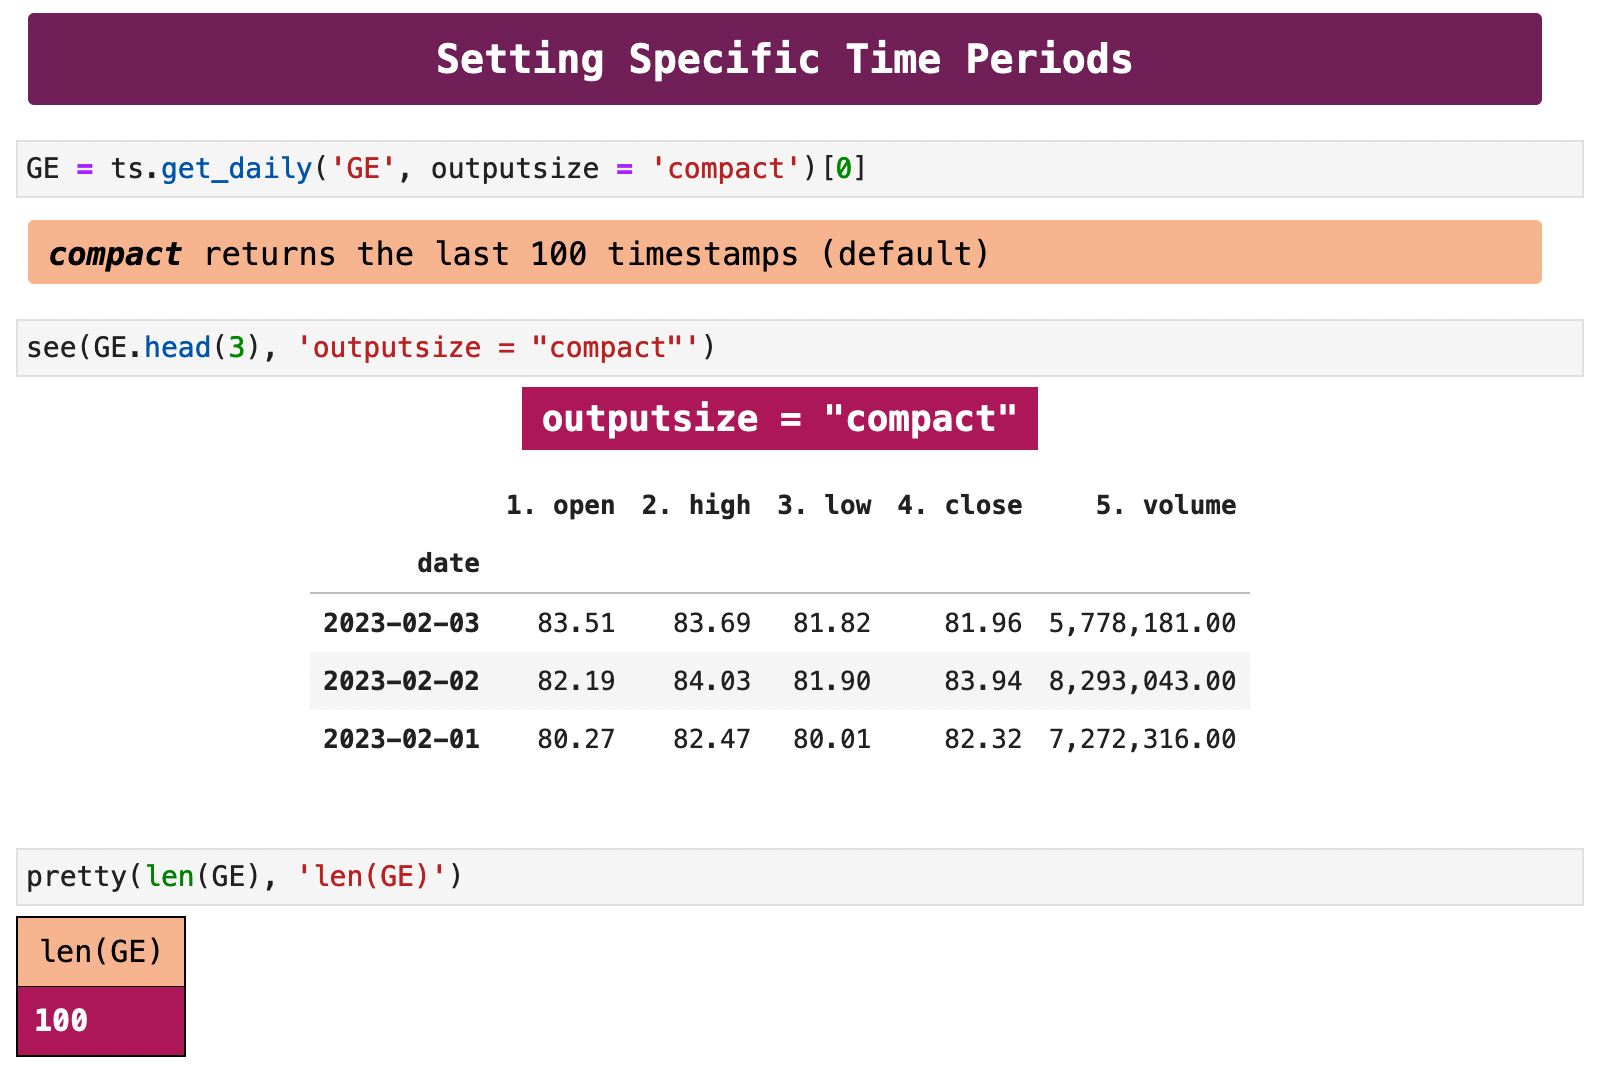
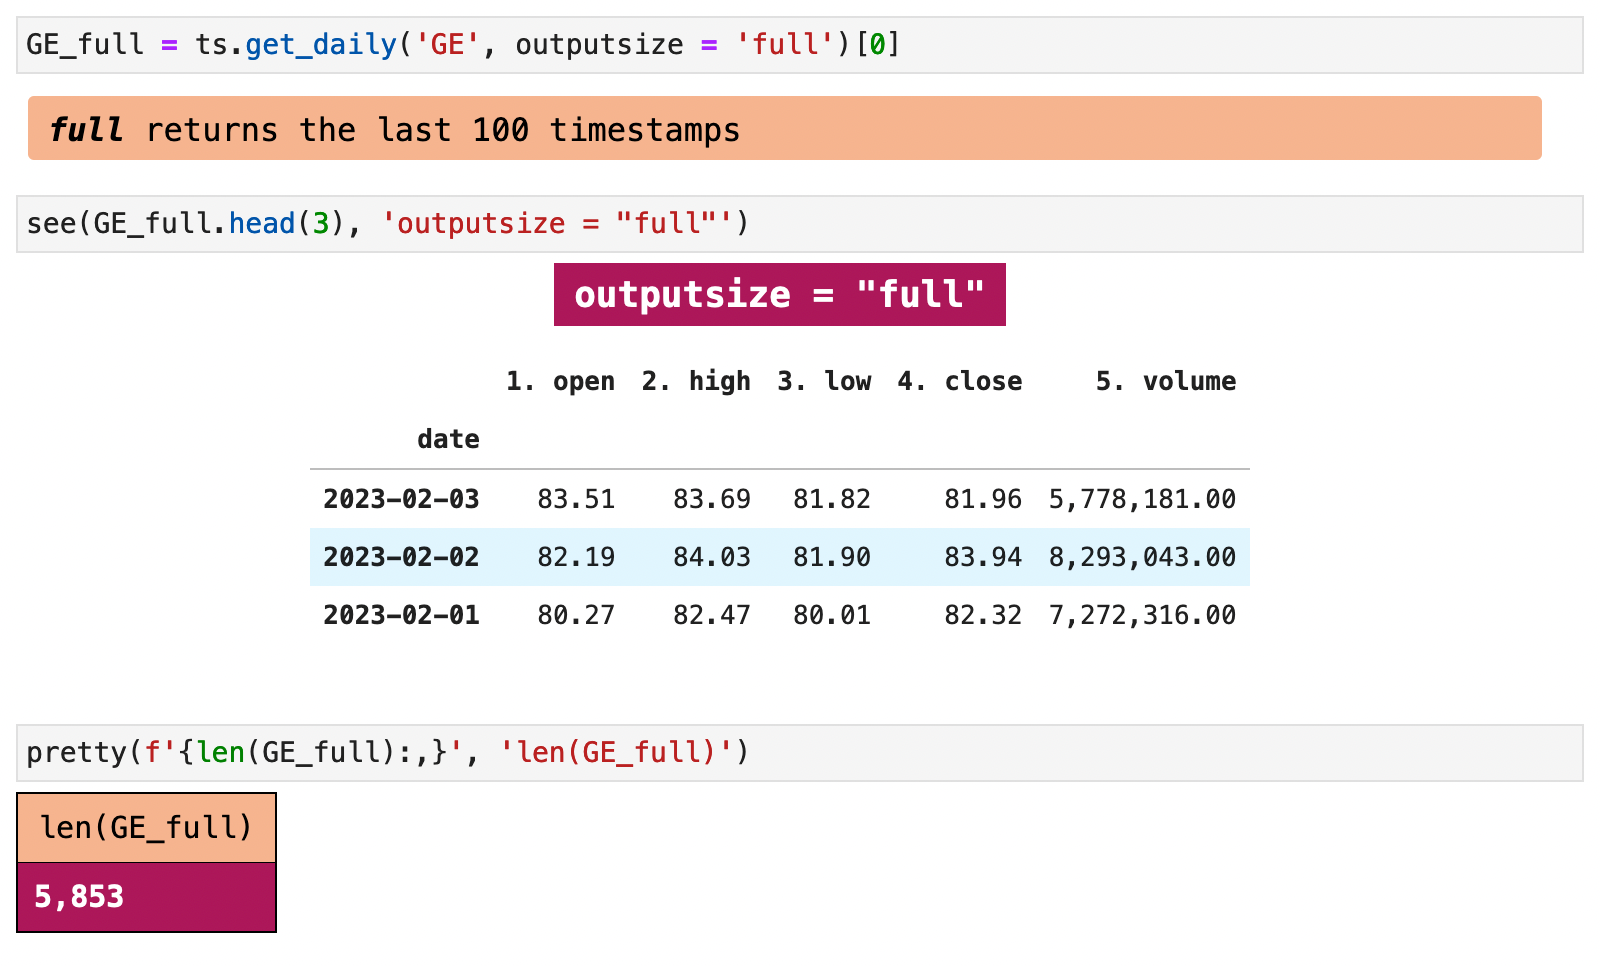
Another difference between Alpha Vantage and using Yahoo Finance is that there are really only two ways of getting date ranges in Alpha Vantage: compact and full. Compact contains 100 records, whereas full returns the maximum number of records allowed. For more information about these limits, be sure to check out the Alpha Vantage site, as the limits are subject to change at any time depending on account type, etc.
| Jump to: | Top | Getting Data | Splits & Dividends | The Datetime Index | Frequency & Intervals | Technical Indicators | Foreign Exchange | Cryptocurrencies | |
|---|
2. Splits and Dividends
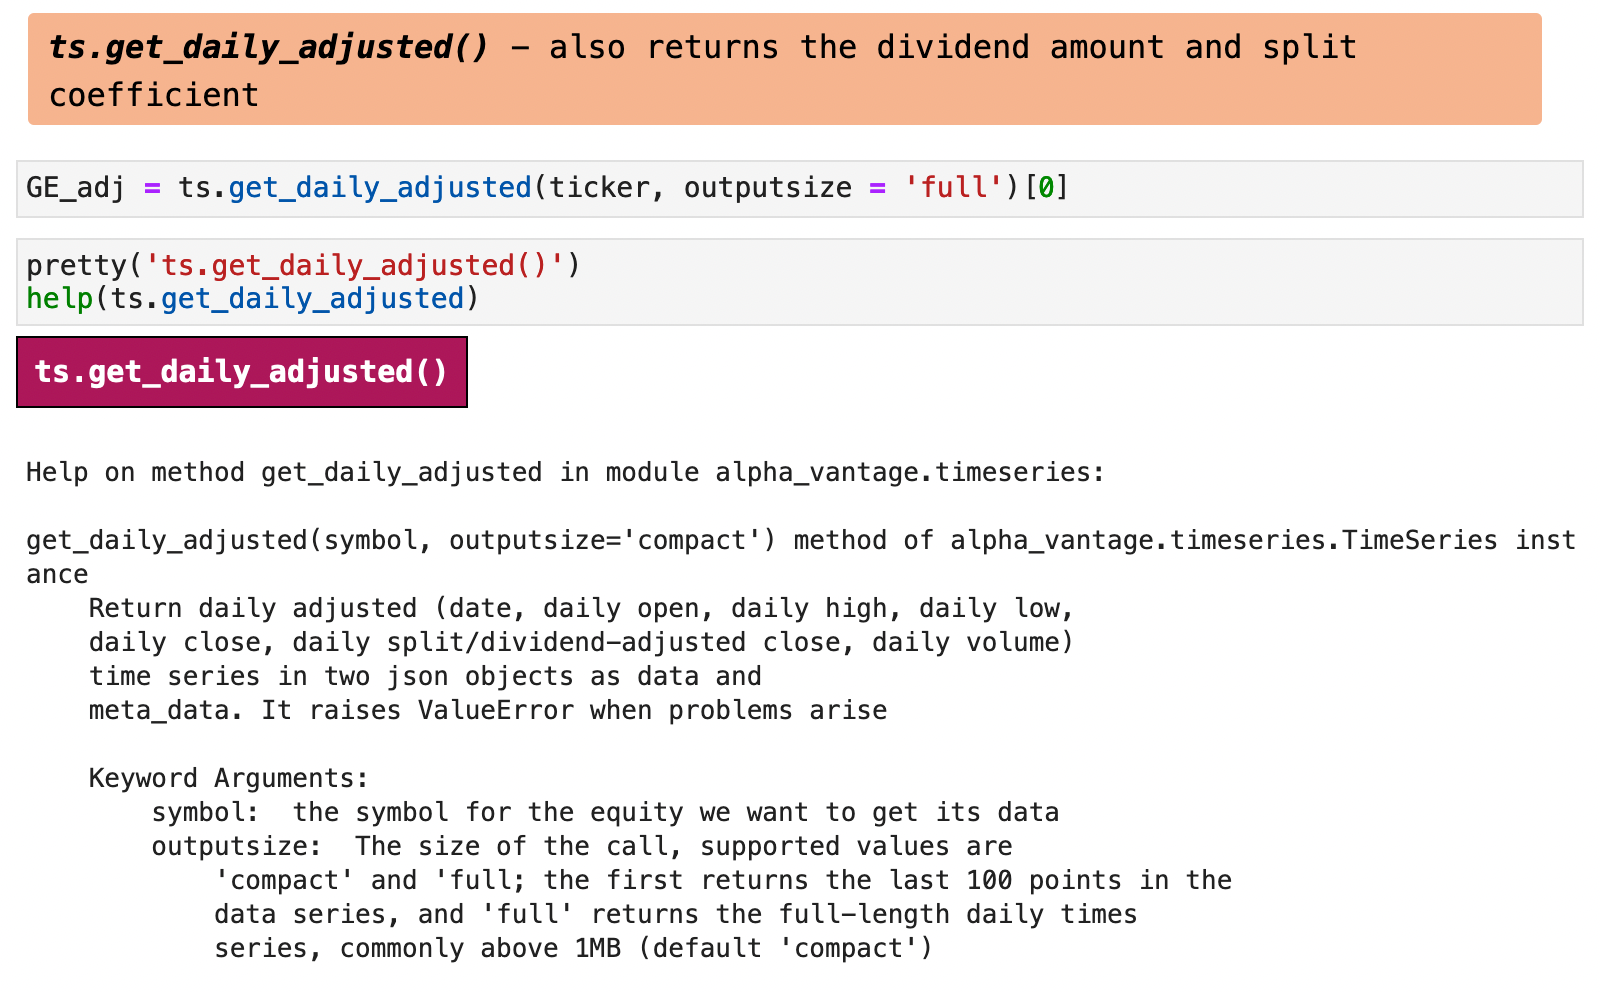
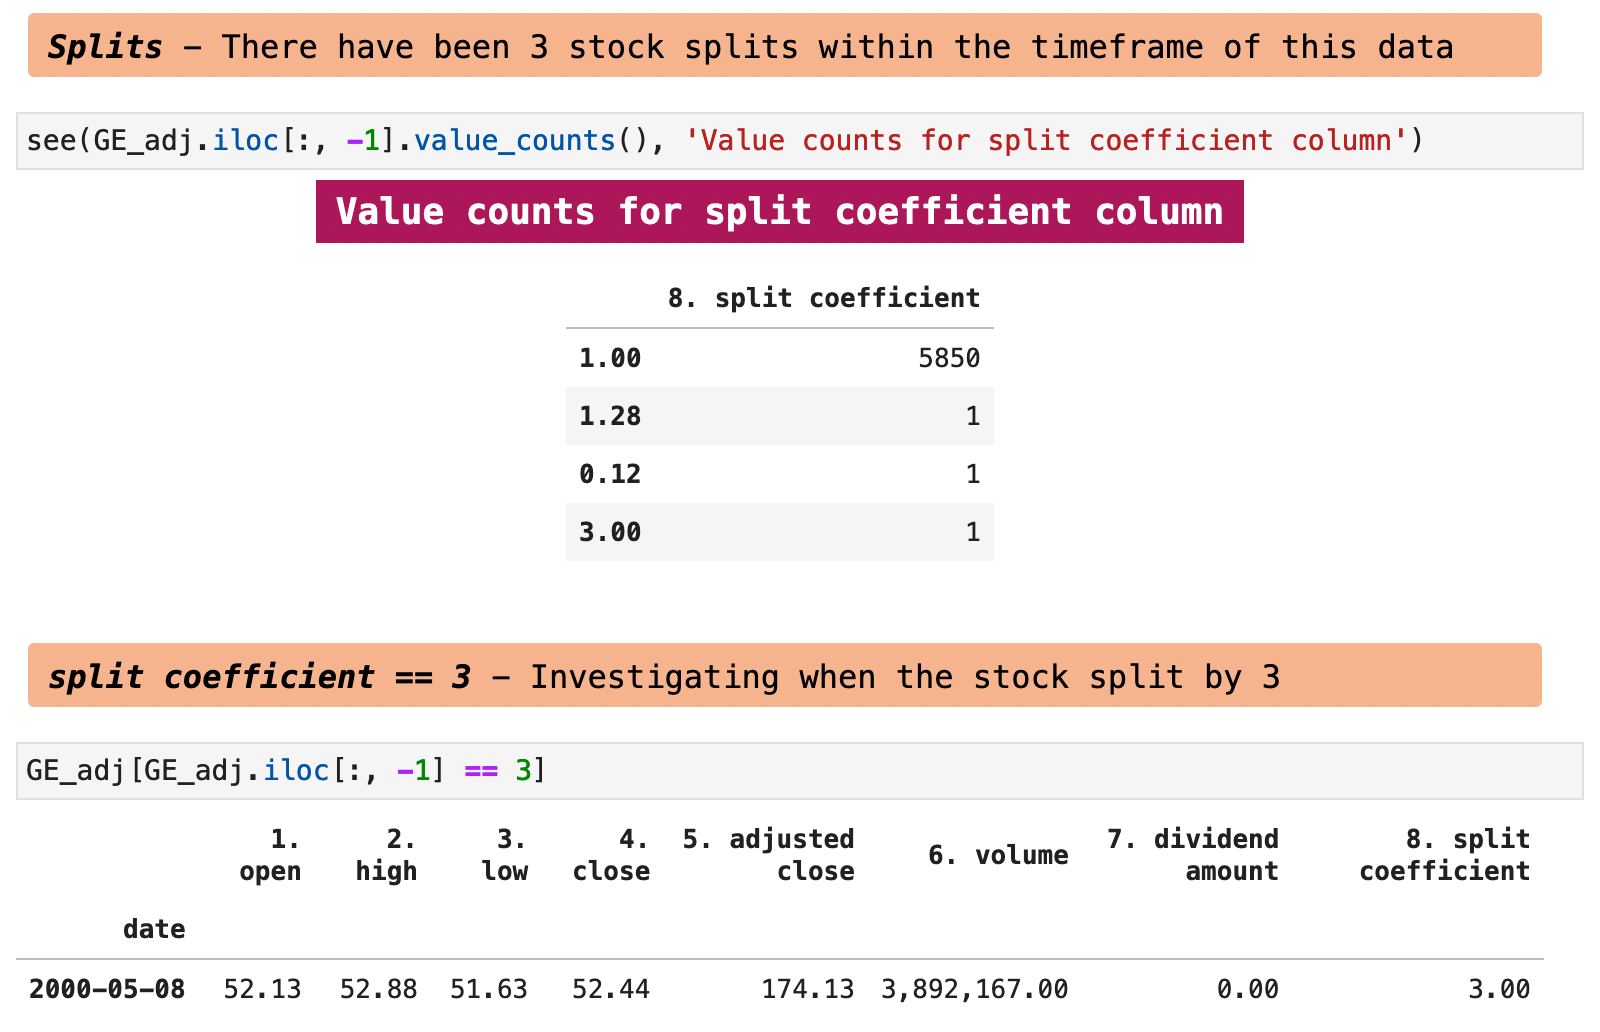
To get data that incorporate calculations for stock splits, and dividends, Alpha Vantage has the get_daily_adjusted() method for the TimeSeries() object.

If we look at the value counts in the split coefficient column, we can see that any record that contains a number other than 1 indicates a time that a stock split occurred.
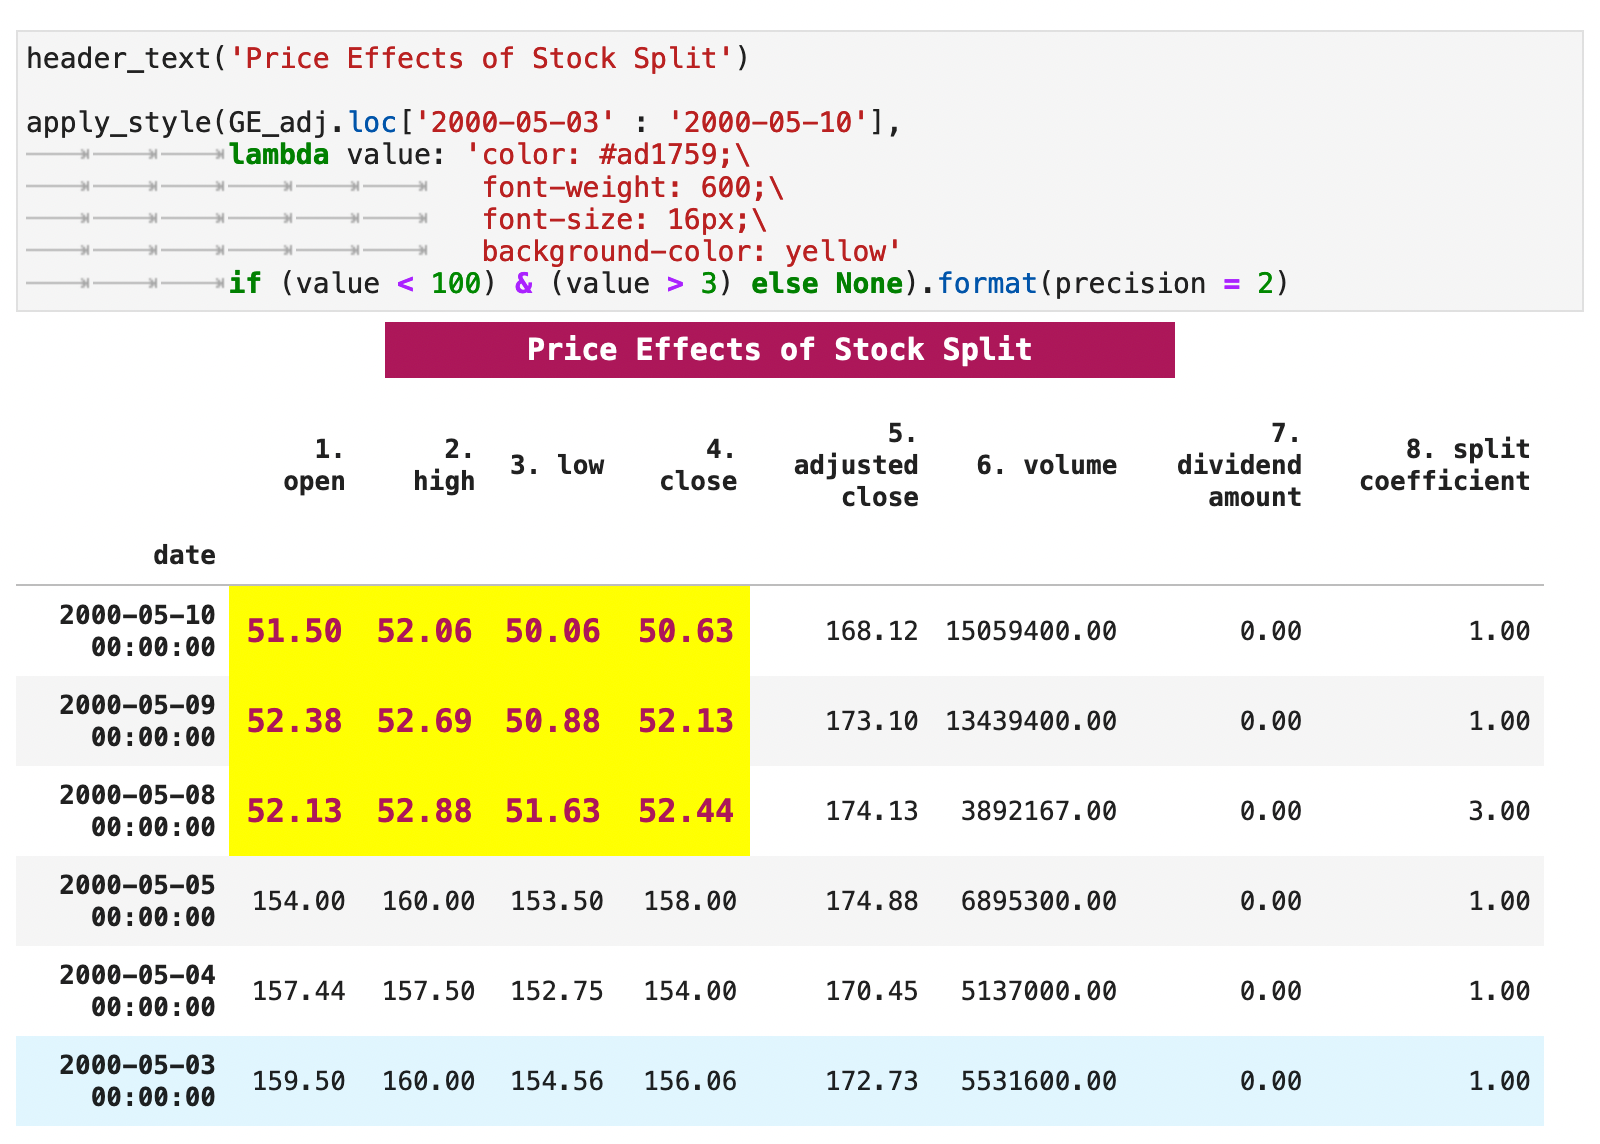
And here I have highlighted the drop in stock price that resulted from GE's most recent stock split in 2000.
| Jump to: | Top | Getting Data | Splits & Dividends | The Datetime Index | Frequency & Intervals | Technical Indicators | Foreign Exchange | Cryptocurrencies | |
|---|
3. Datetime Index
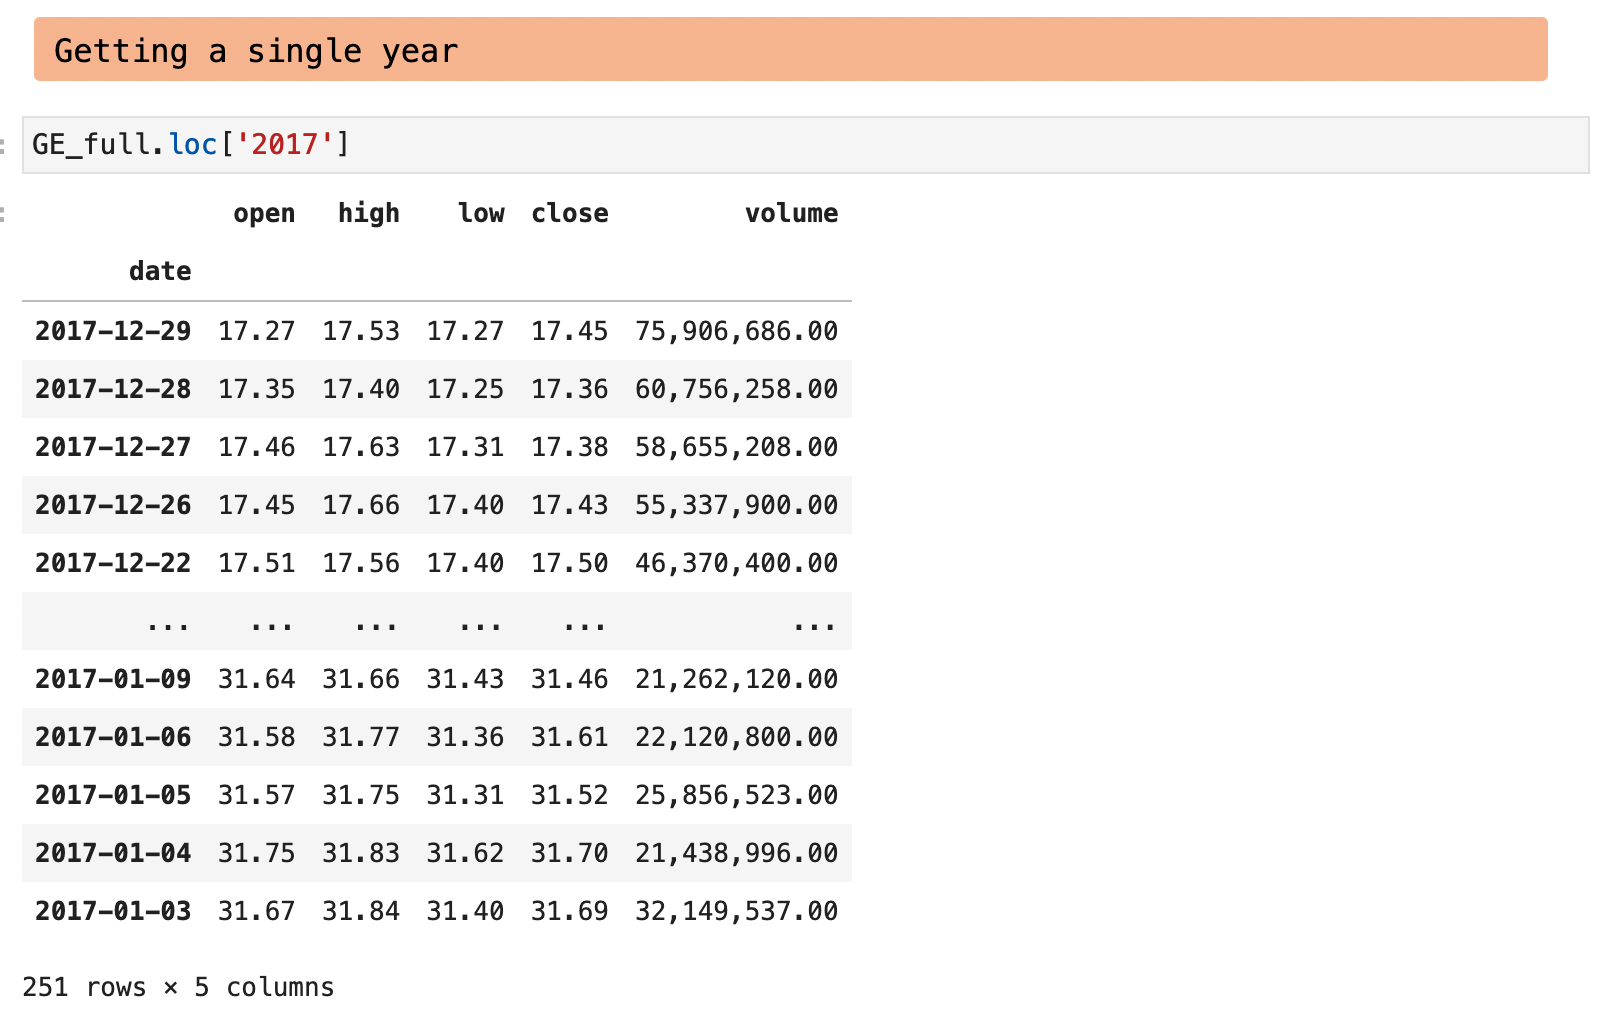
It was not until recently that Alpha Vantage returned data with a datetime index. Before recent updates, the dates came back in string format and had to be converted. But since they now give datetime index time series data, it is easy to pull out data by specific time periods. In the following example, I retrieved just the data for a single year, 2017.
| Jump to: | Top | Getting Data | Splits & Dividends | The Datetime Index | Frequency & Intervals | Technical Indicators | Foreign Exchange | Cryptocurrencies | |
|---|
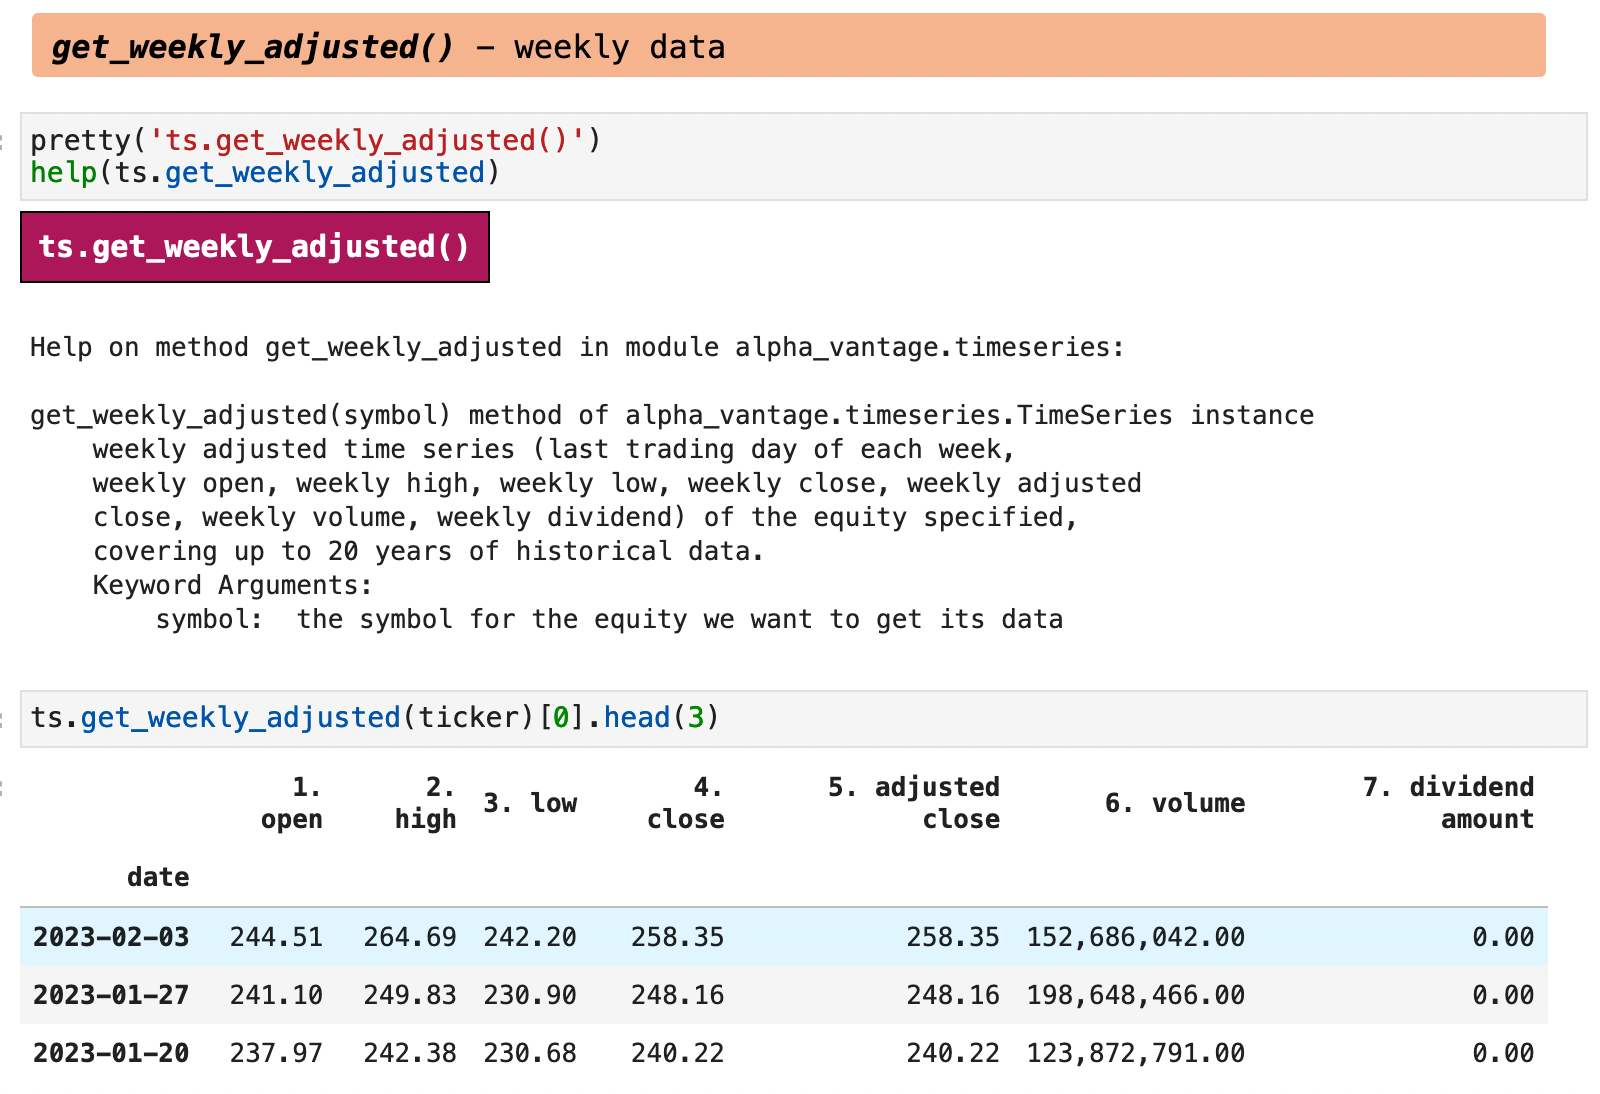
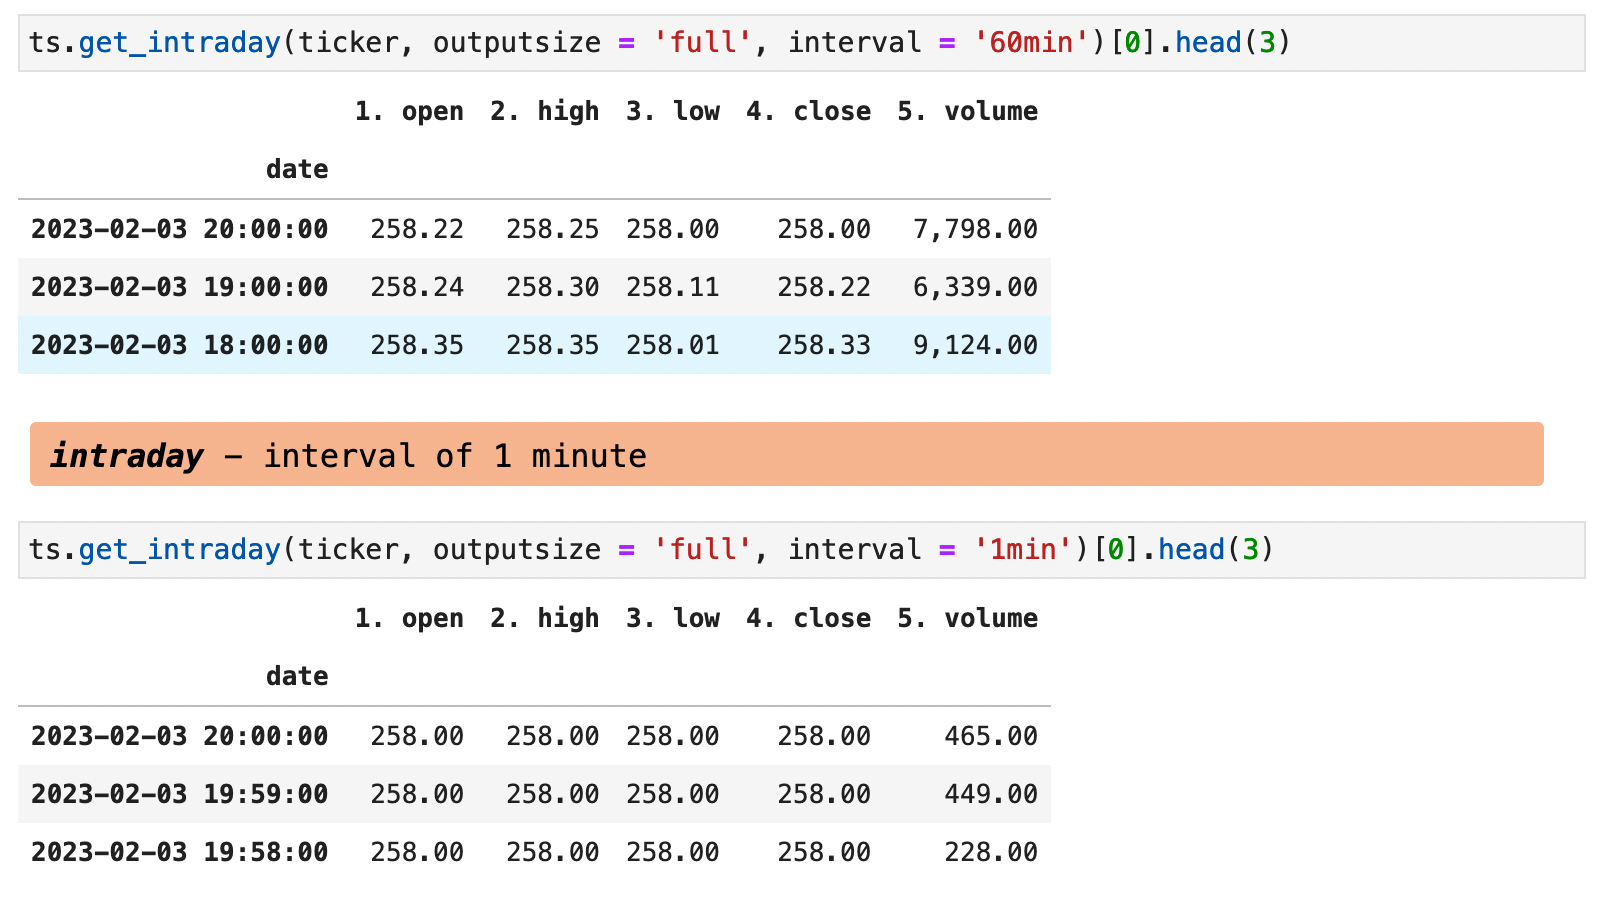
4. Frequency & Intervals
The following code walks through the various ways of getting different intervals of data with Alpha Vantage. It is a bit clunkier than Yahoo Finance in that there is a different function for each interval rather than just specifying an interval as an argument to the same querying function.

| Jump to: | Top | Getting Data | Splits & Dividends | The Datetime Index | Frequency & Intervals | Technical Indicators | Foreign Exchange | Cryptocurrencies | |
|---|
5. Technical Indicators
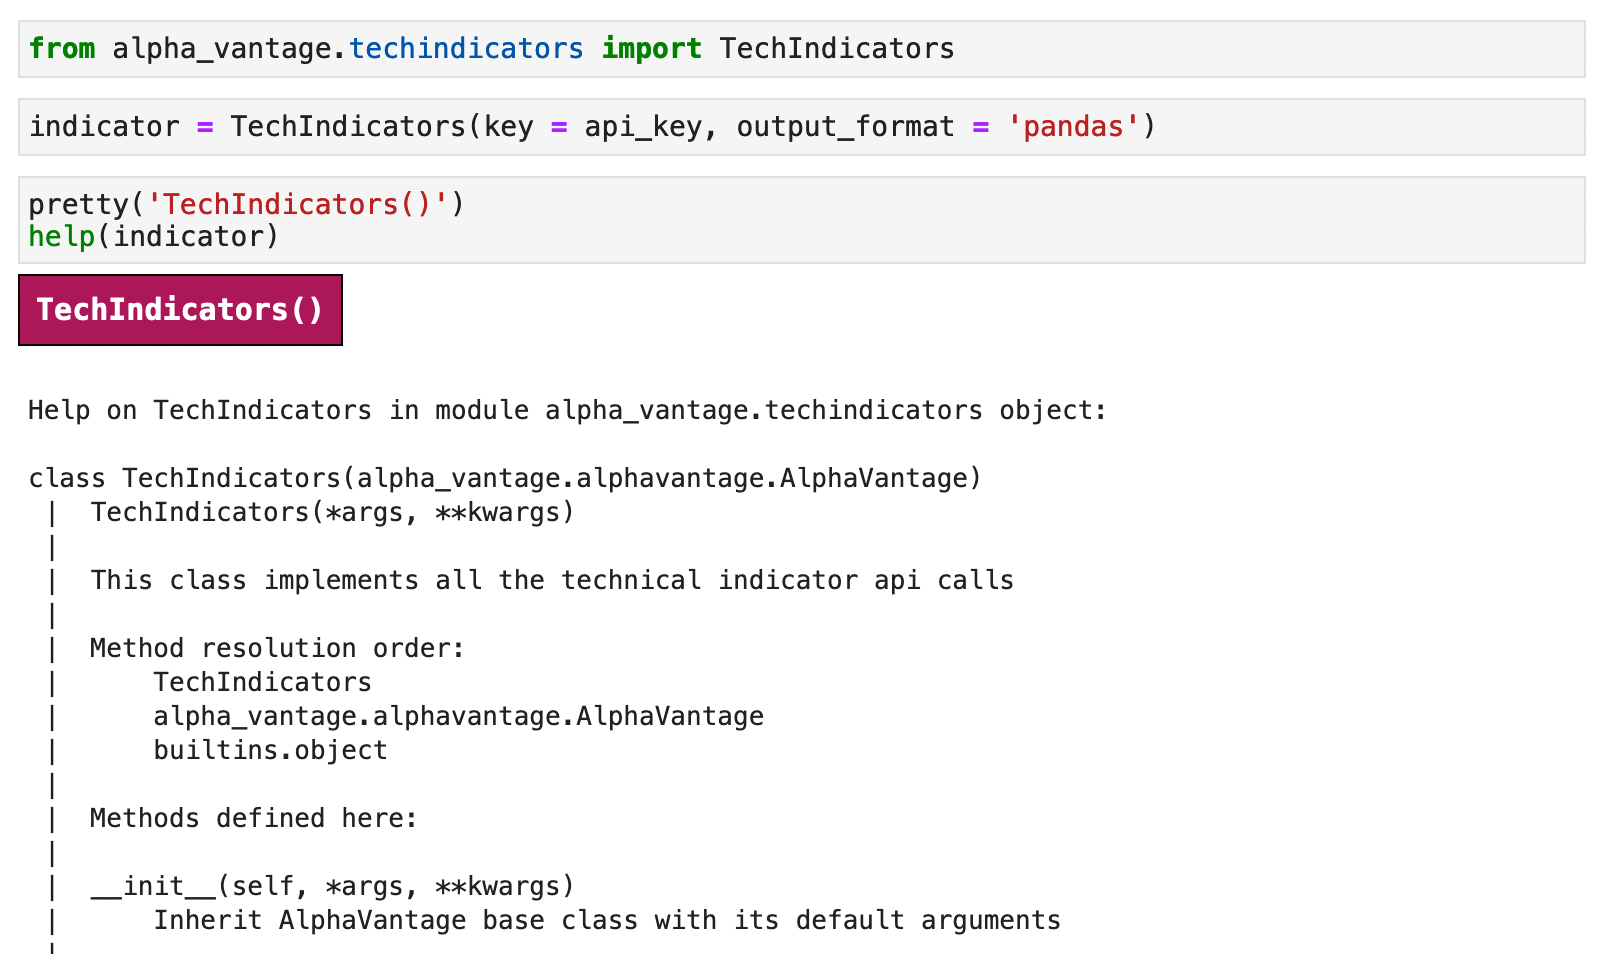
Technical indicators is the one place where Alpha Vantage impressed me, enough so that I felt compelled to write this article. They offer 50 different technical indicators that can be used in working with financial data and making more enlightened future predictions. These are typically used by day traders and technical analysts to find patterns in historical price and volume data. Here, I will walk you through three of the most common and informative indicators.
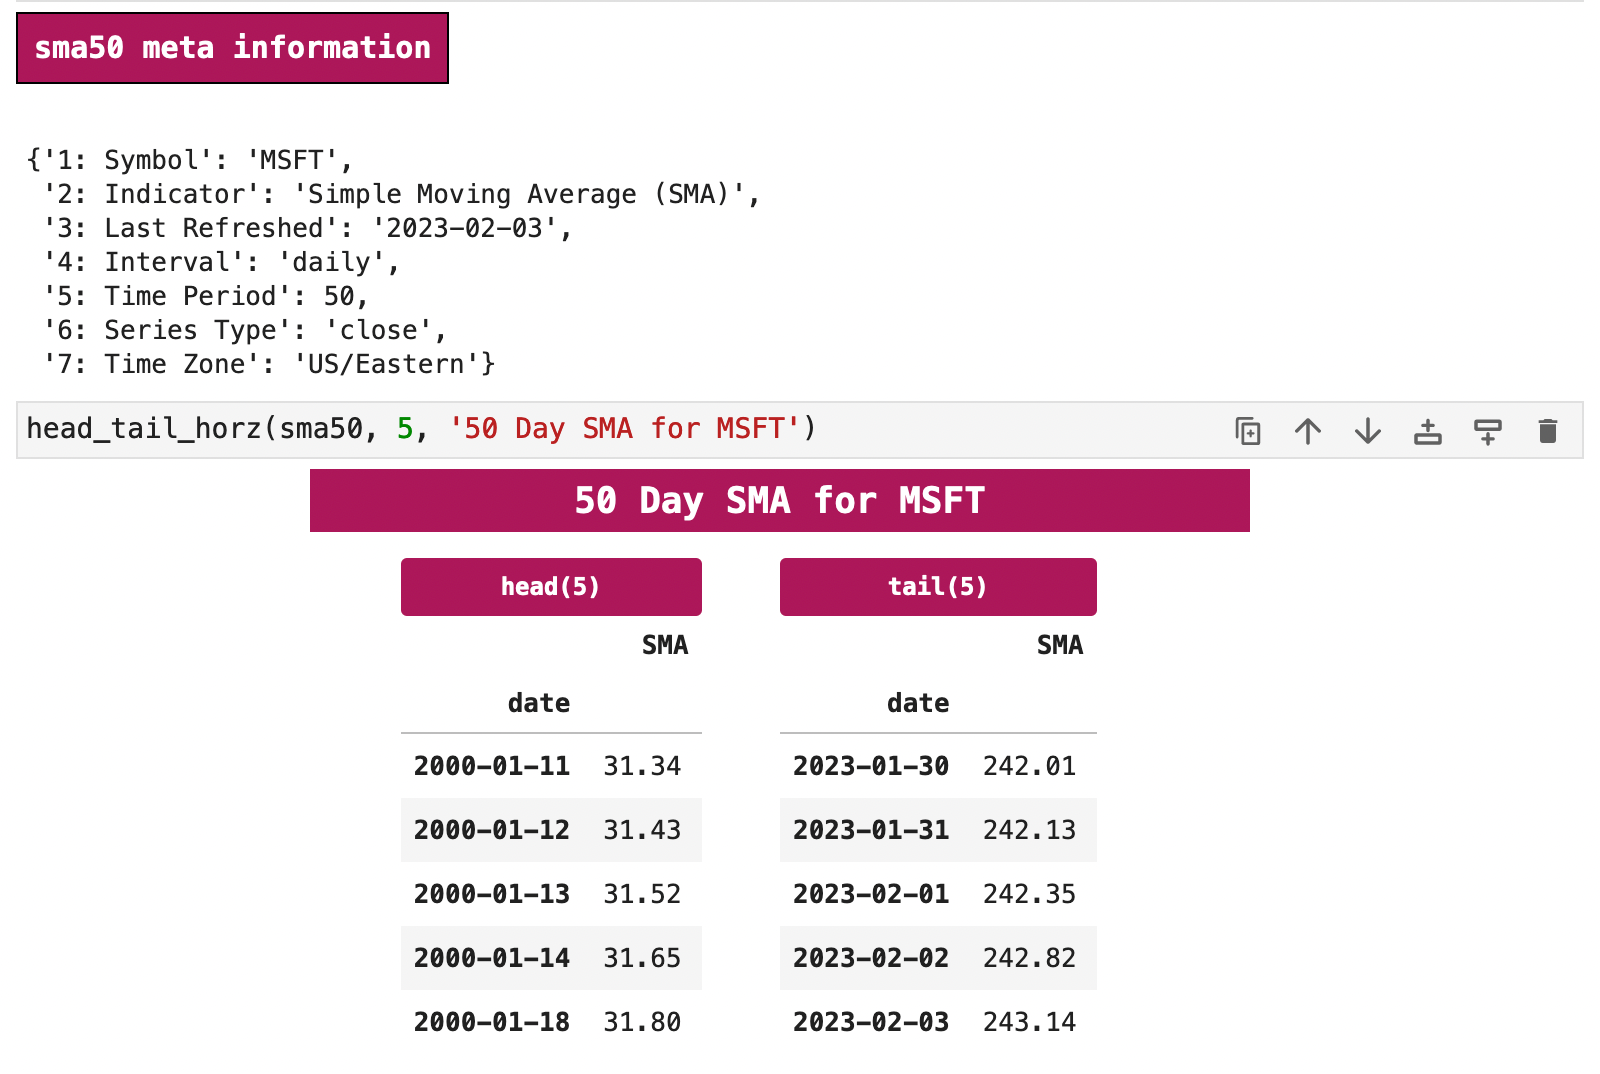
To get technical indicator data, we use the TechIndicators() object as shown below. These are generally calculations one could perform on their own data, but it is quite nice and convenient to be able to quickly download any of these straight from Alpha Vantage.
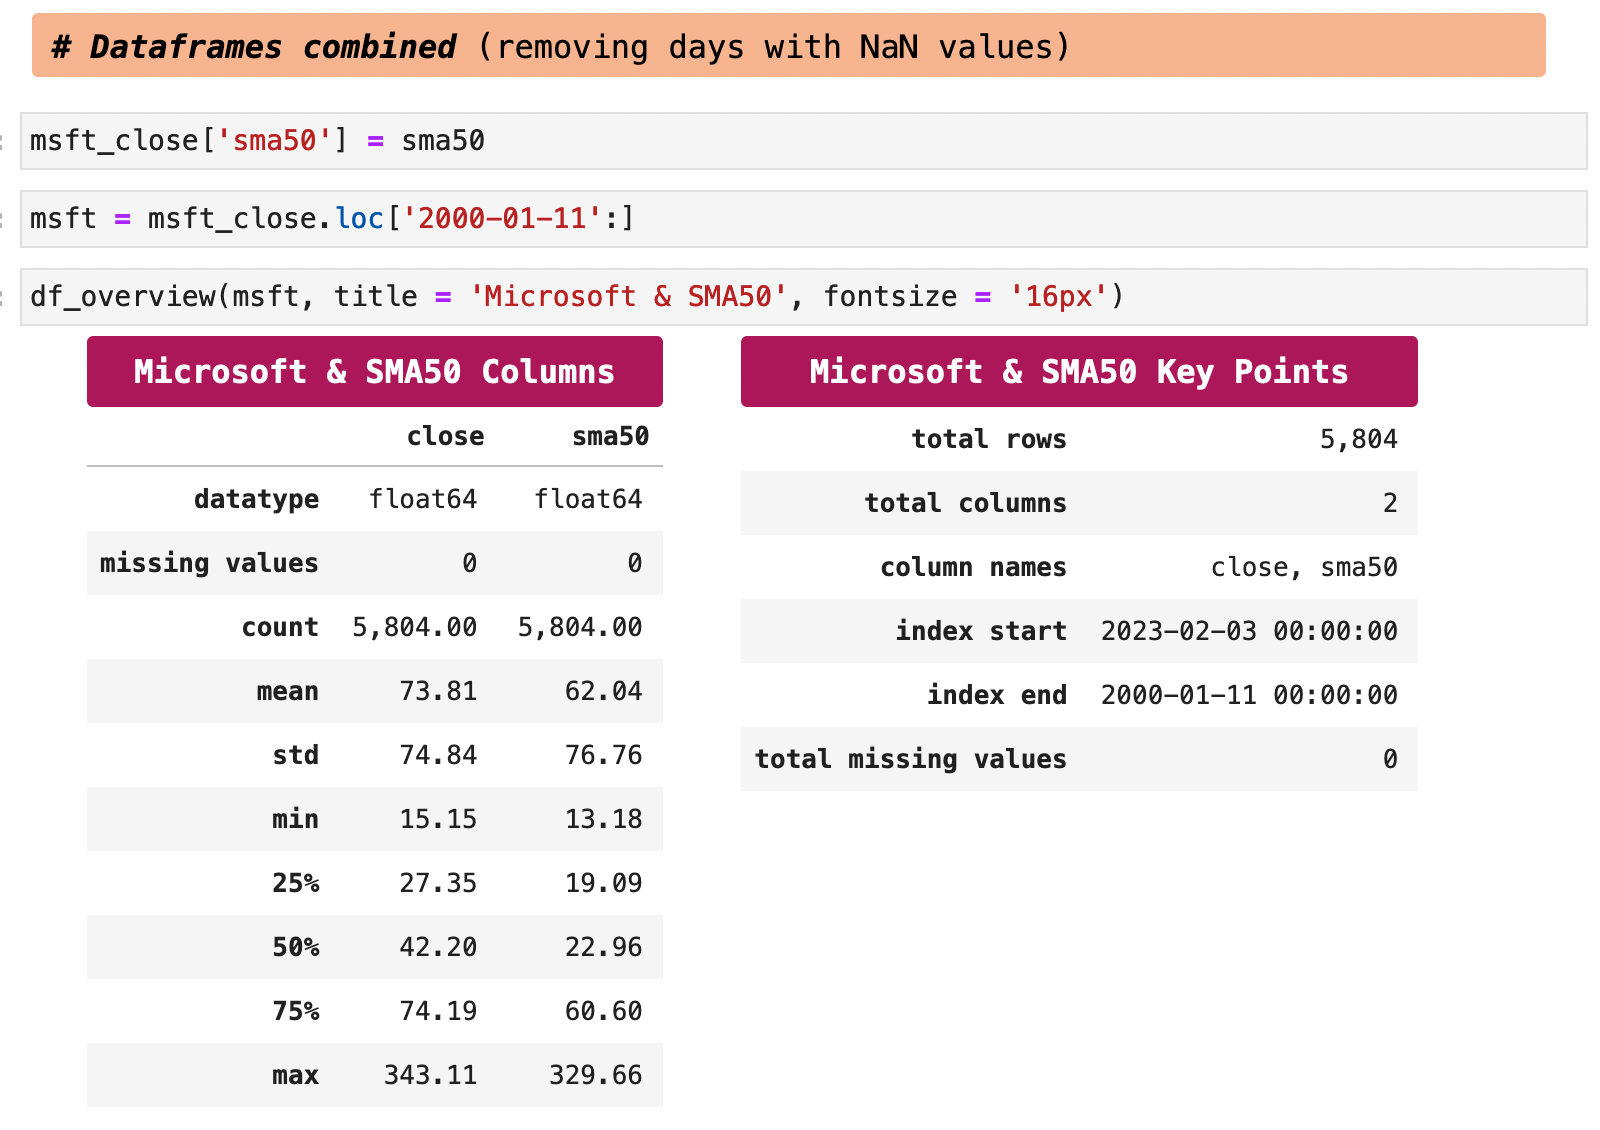
In the next few sections of code and examples, I show how we can use slow moving averages with our data. For my example, I am using an SMA of 50 days and adding the last 50 days average as a new field for each record.
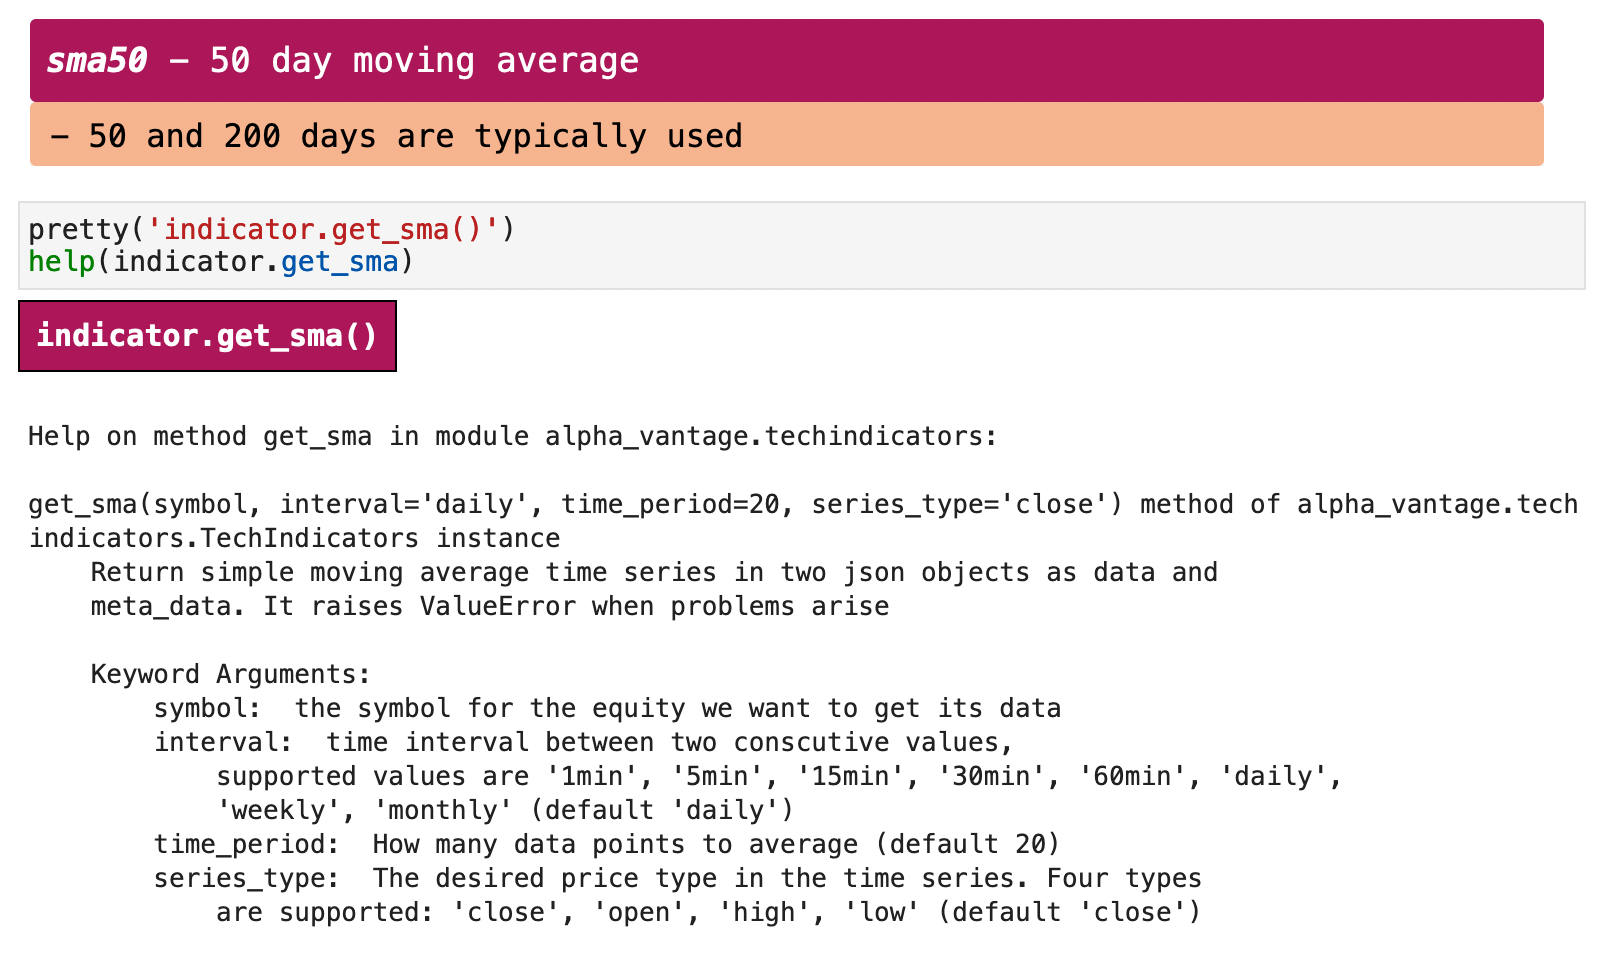

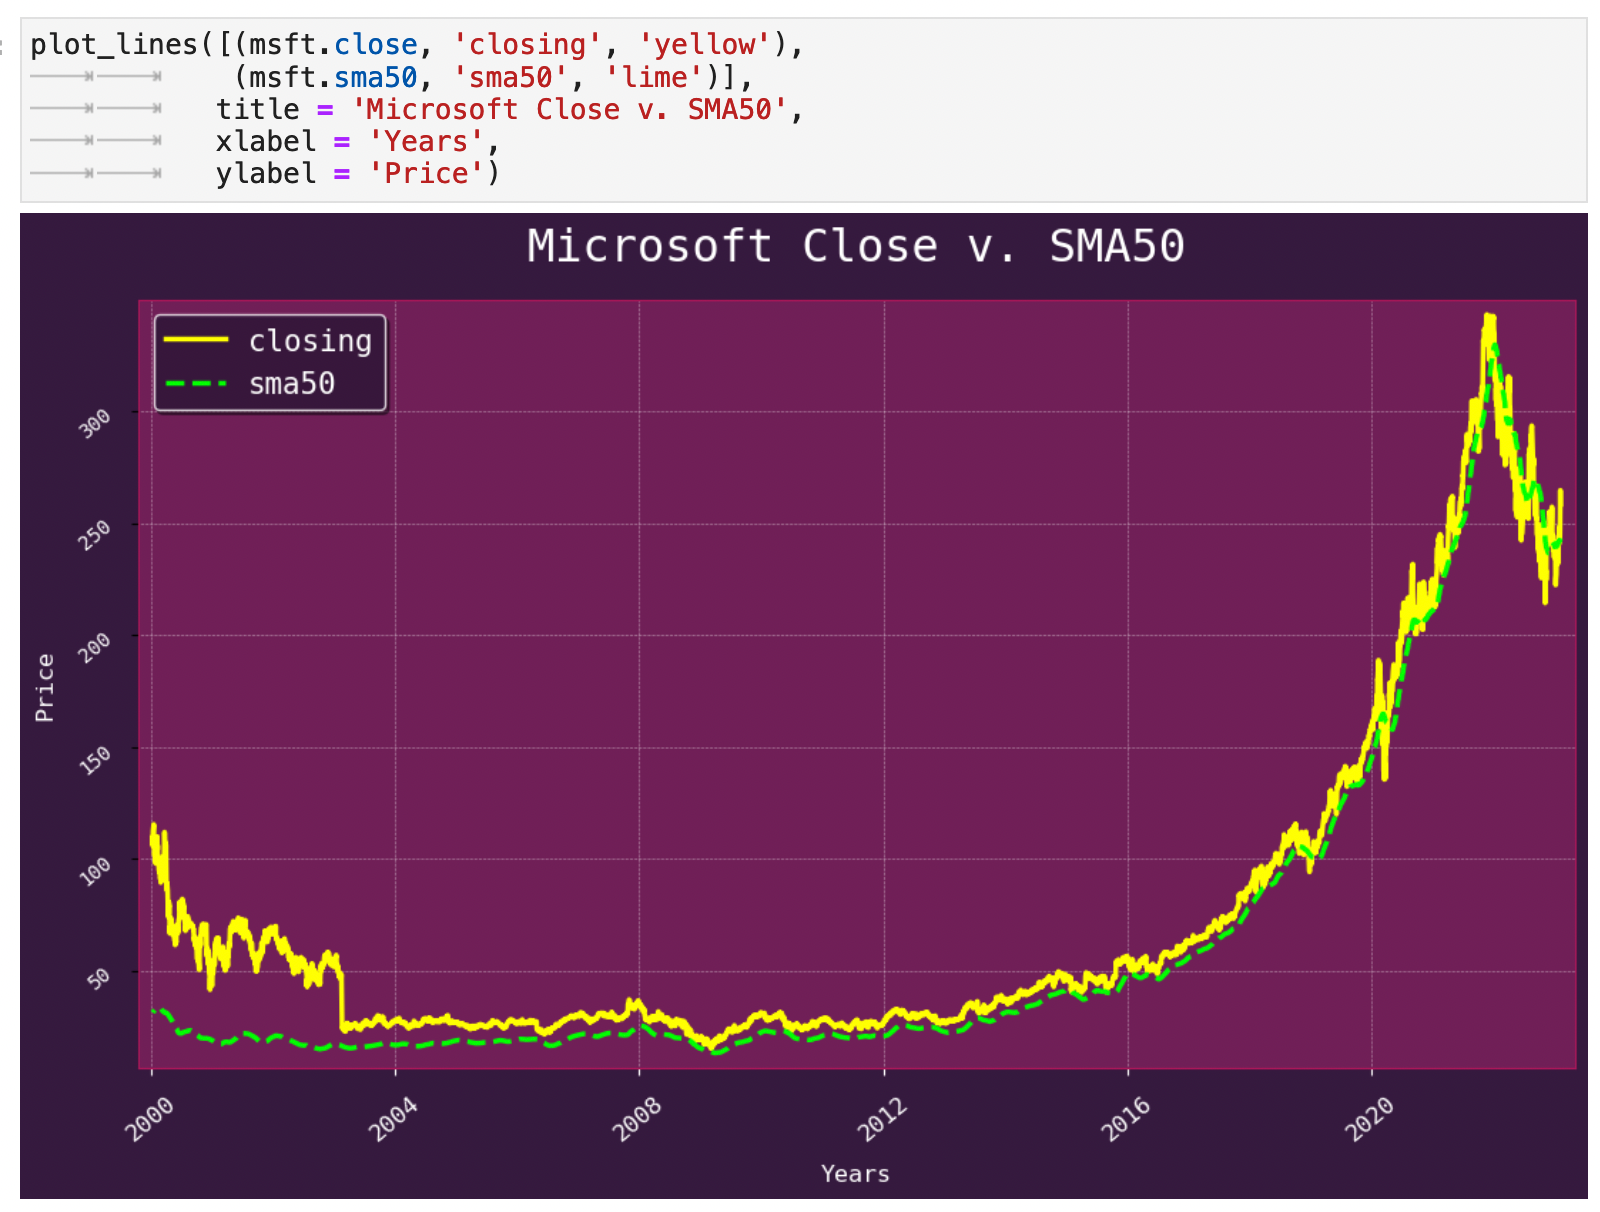
In the following line graph, it is clearn that the SMA50 can be viewed as merely a smoothing of the spiky ups and downs of the stock close price.
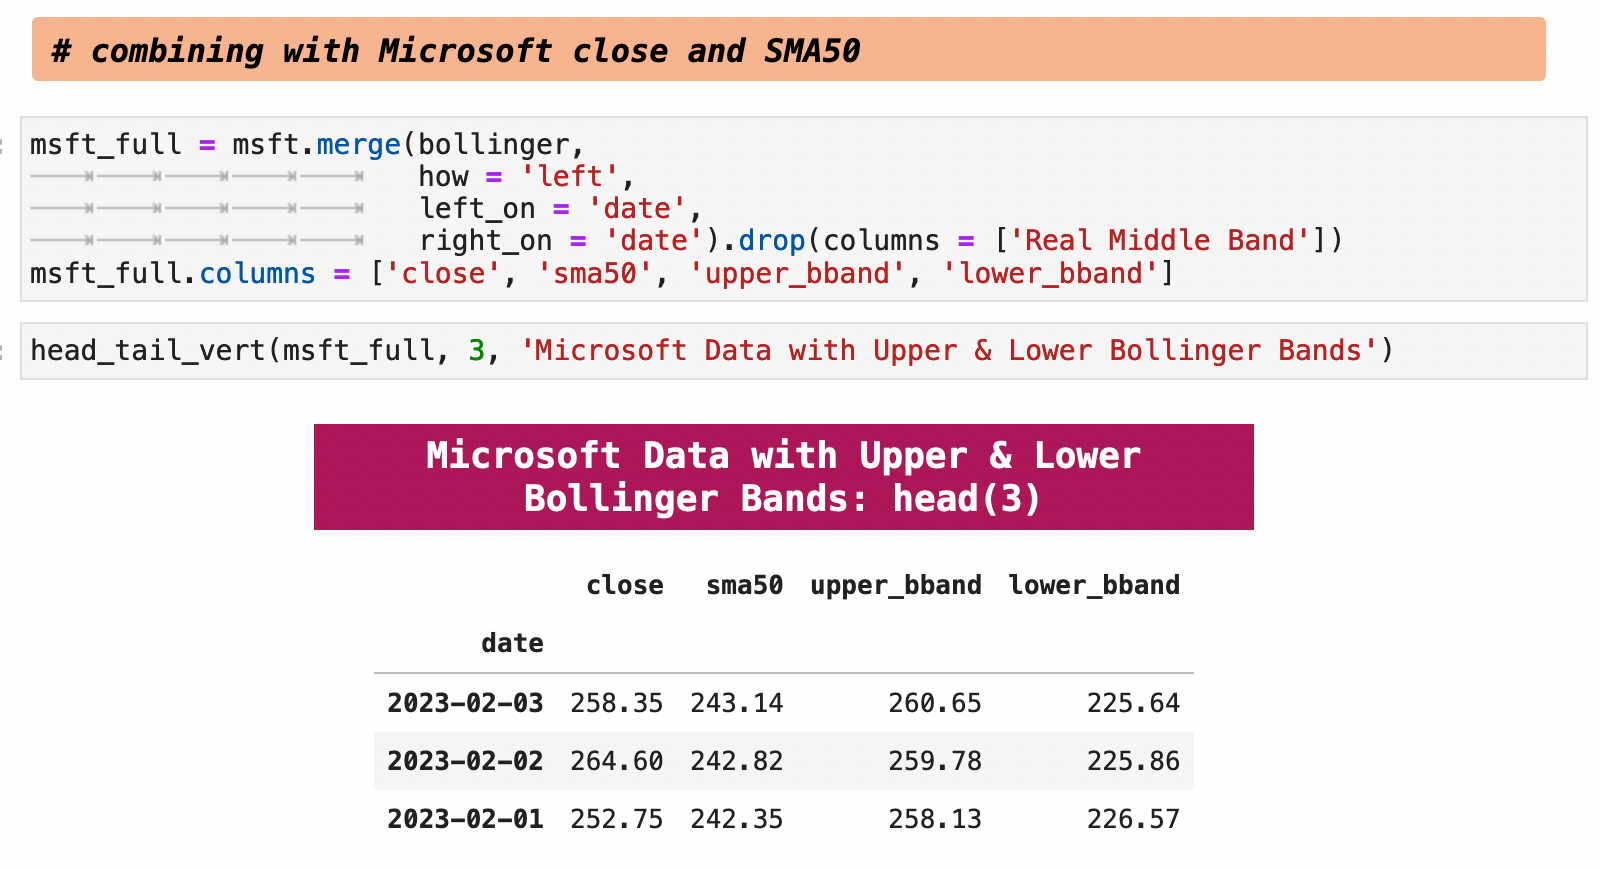
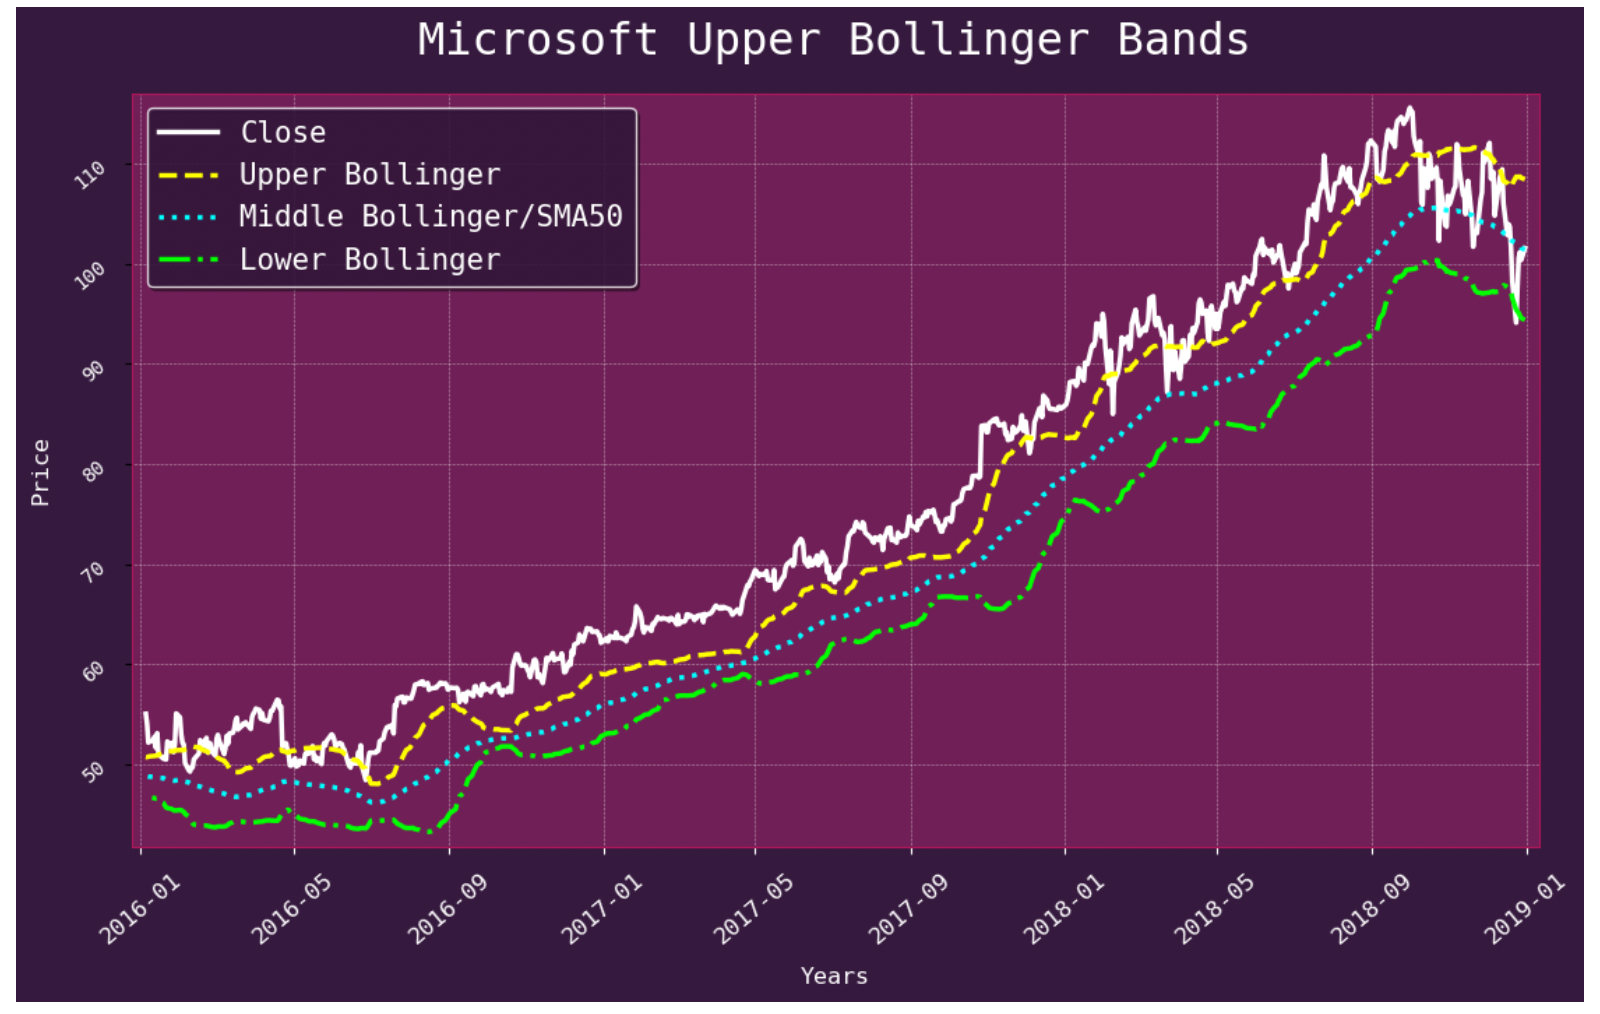
Next we will look at Bollinger Bands, aka BBands. In the markdown cells below, I briefly describe what each calculation indicates.
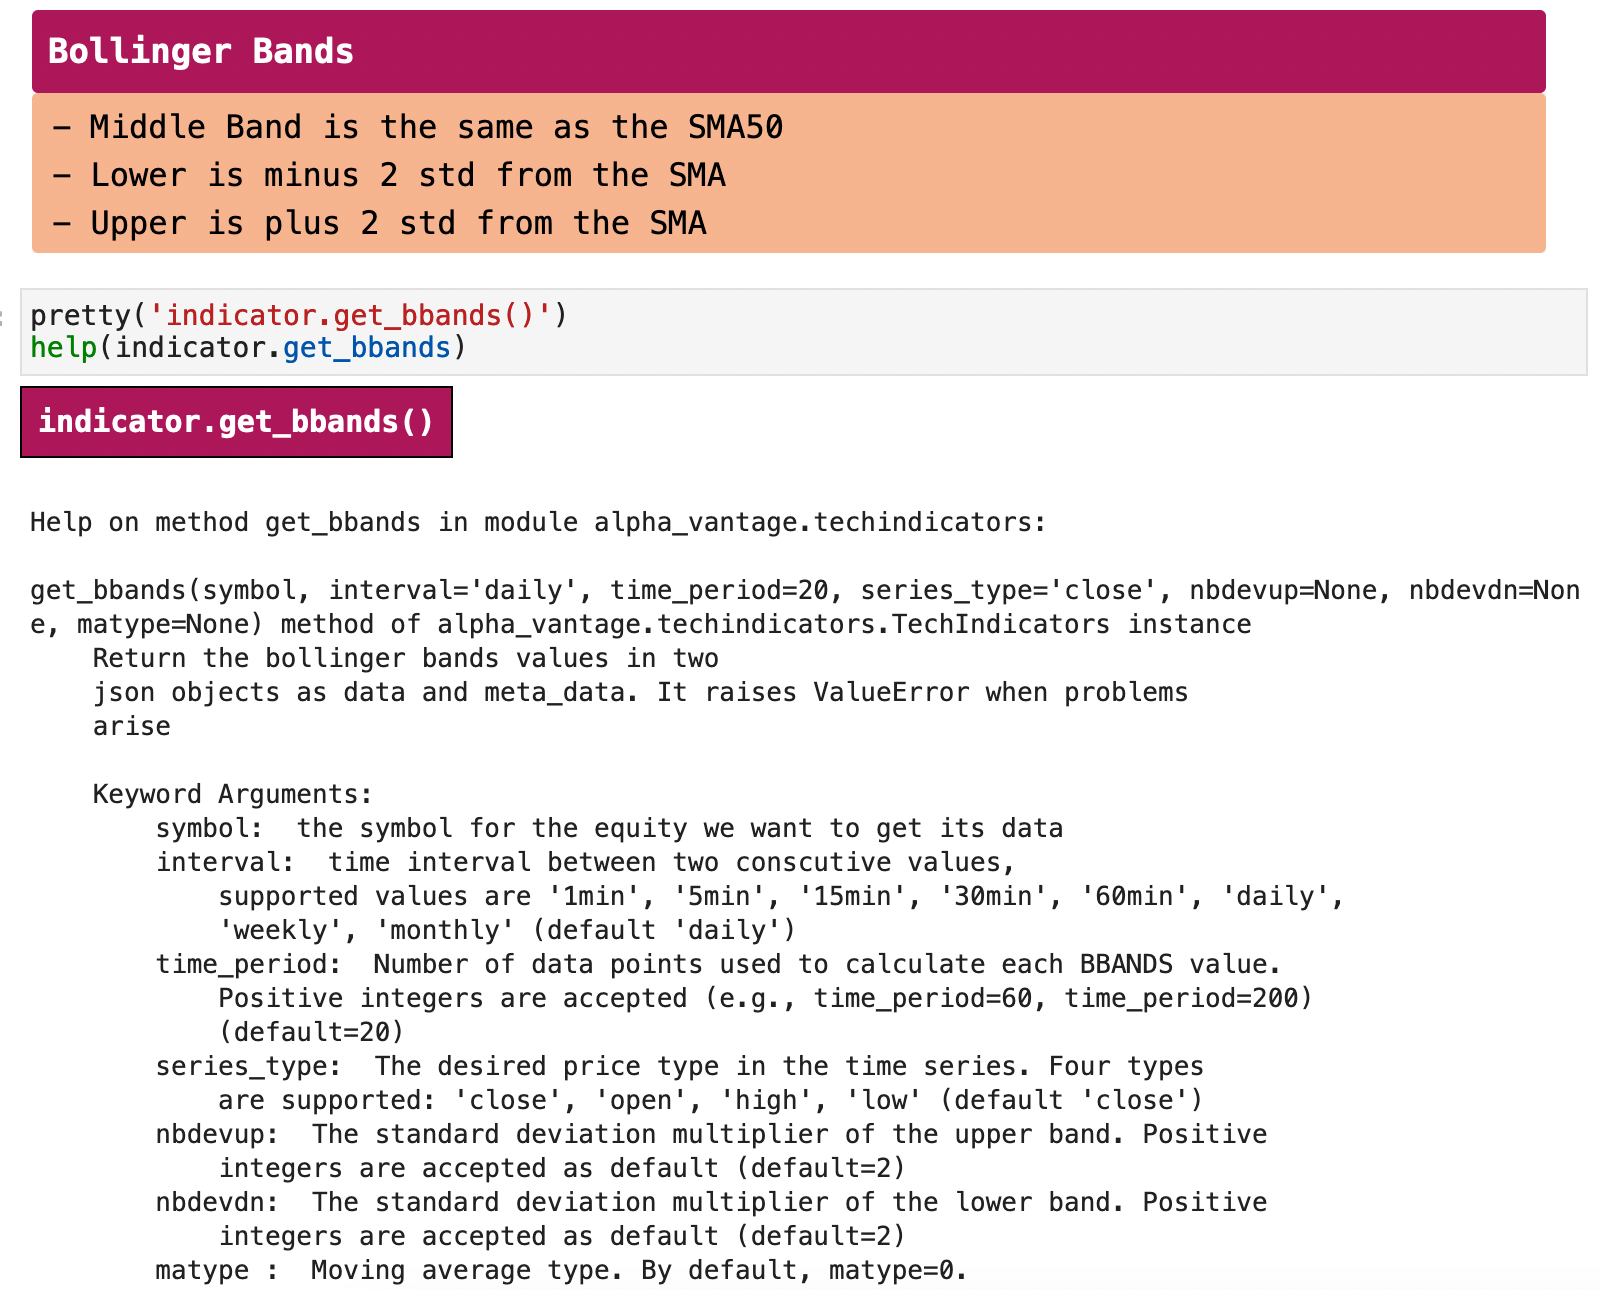
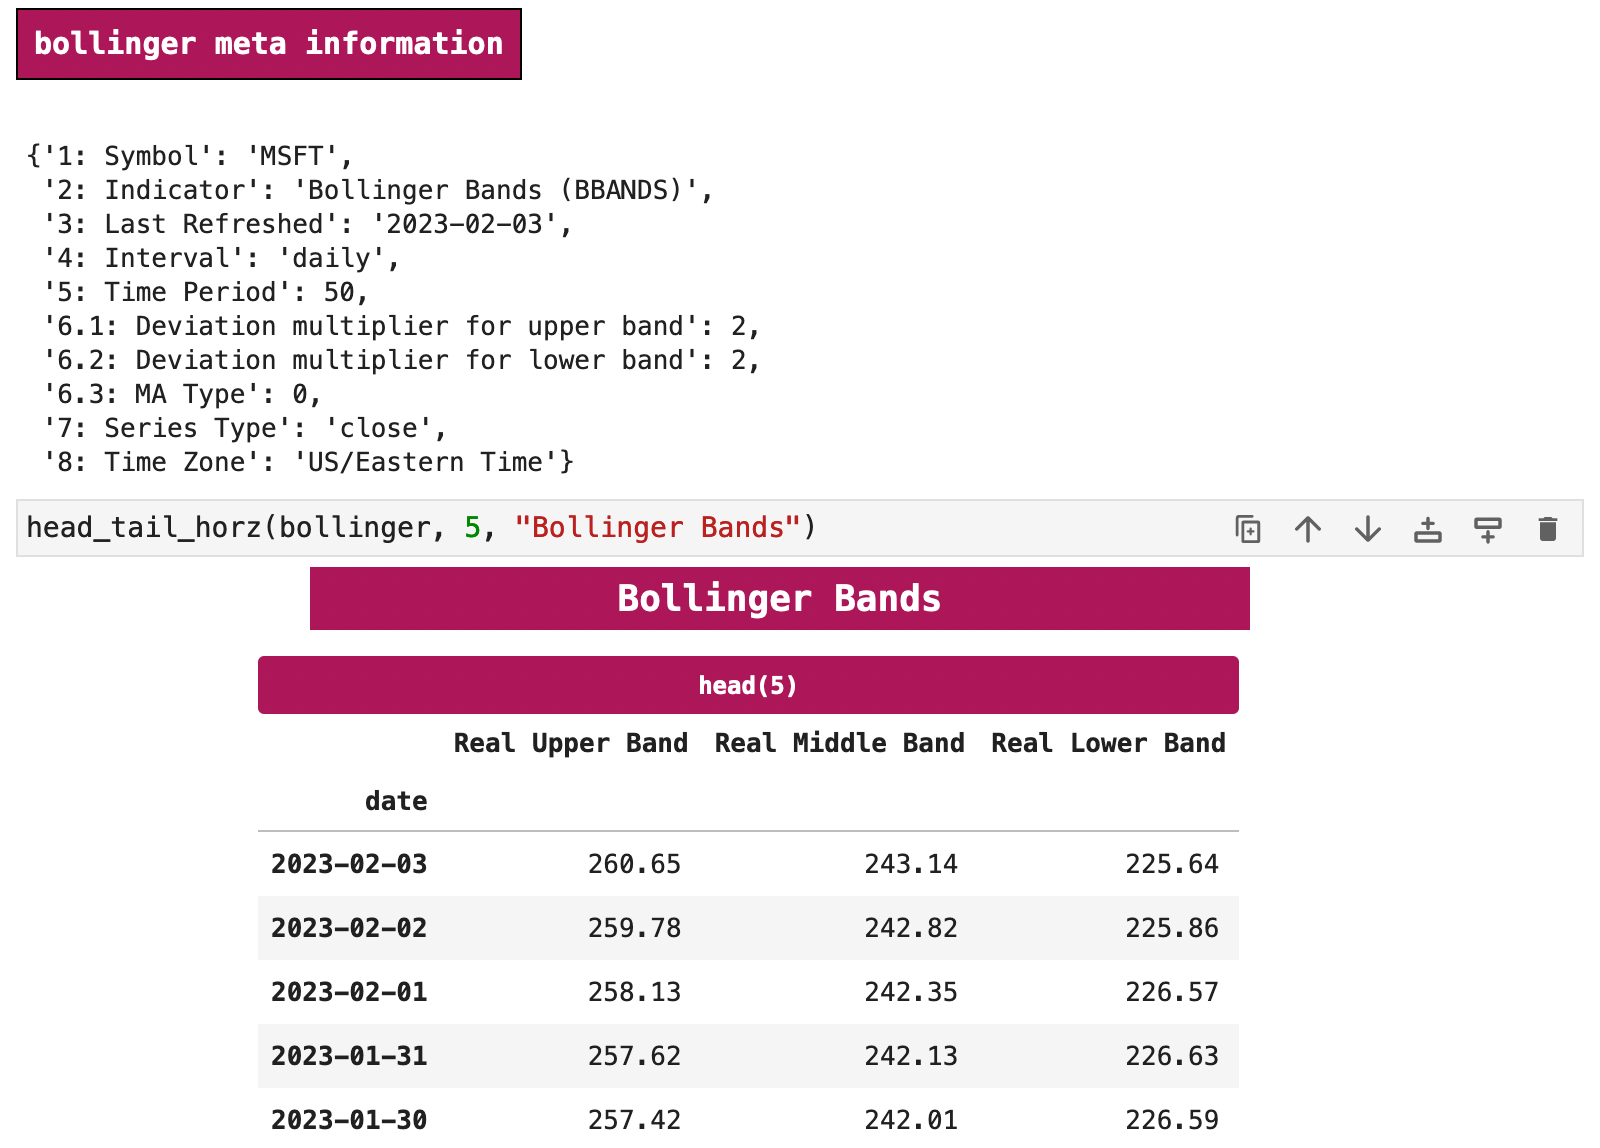
Bollinger Bands indicate volatility:
- if bands are close together, it indicates low volatility
- if they are farther apart, it indicates higher volatility
- if current price is above the upper band, signals selling
- if current price is below the lower band, signals buying
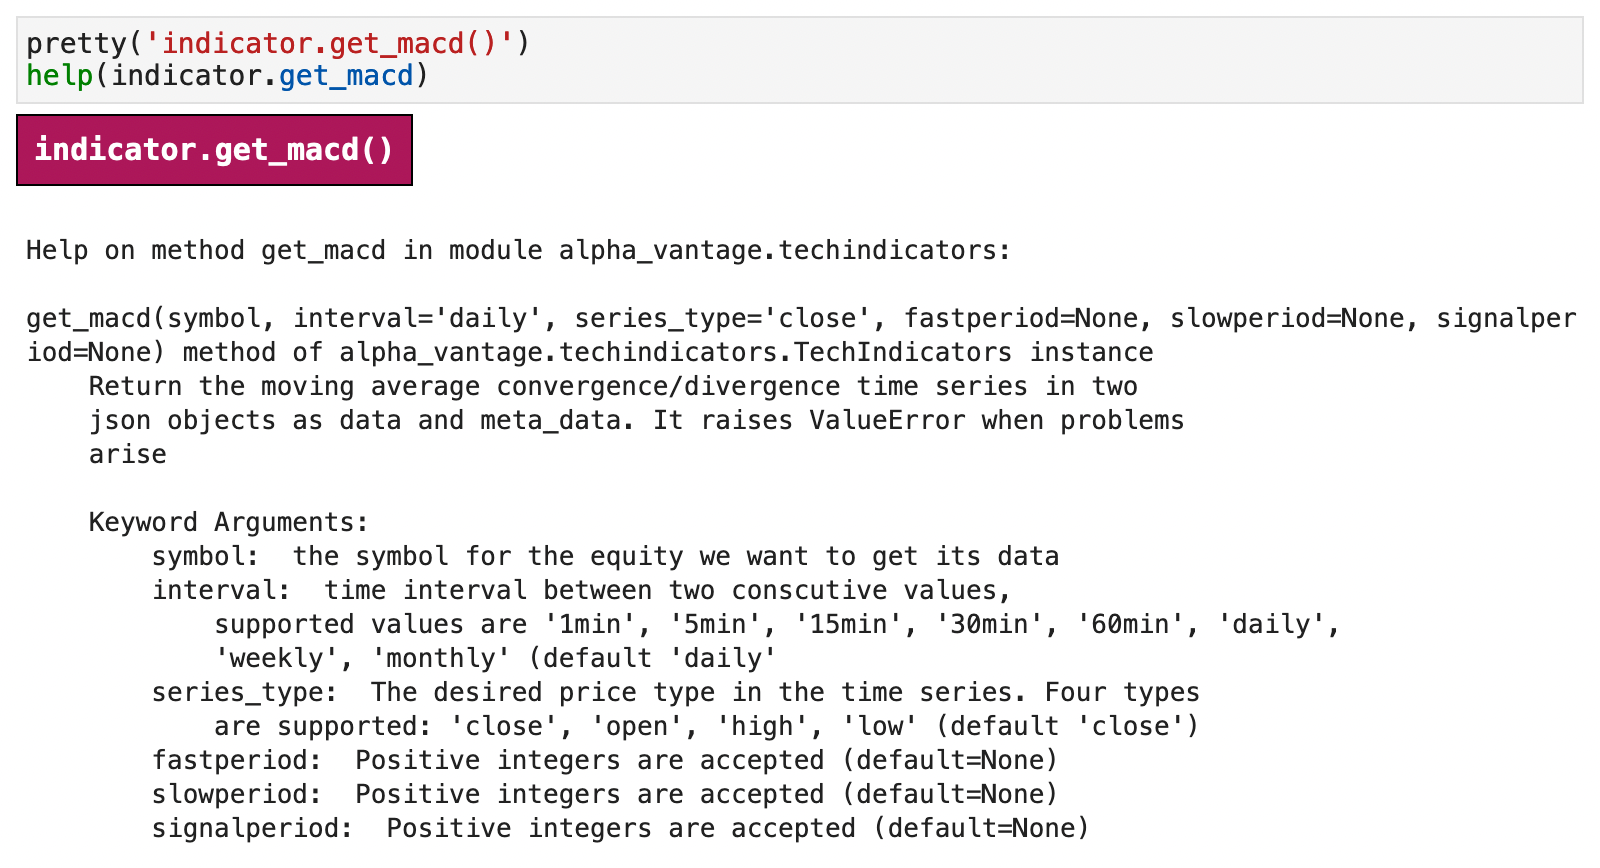
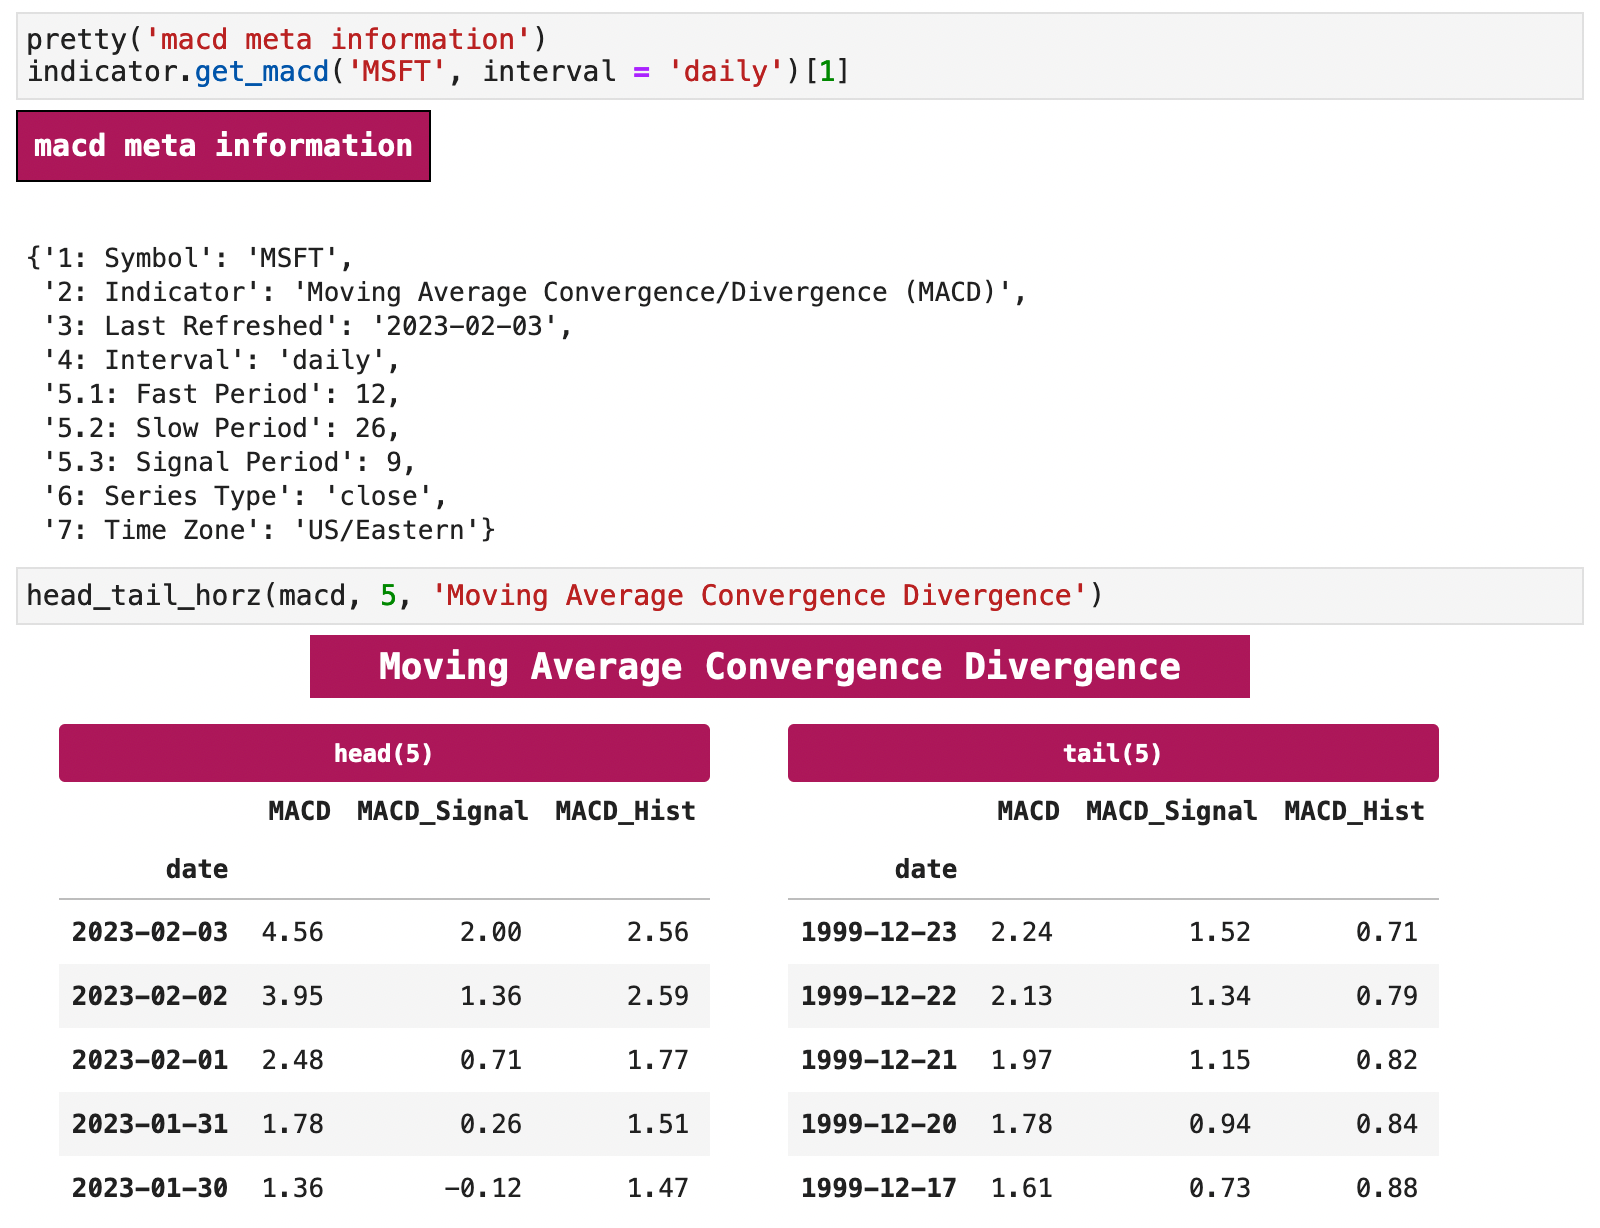
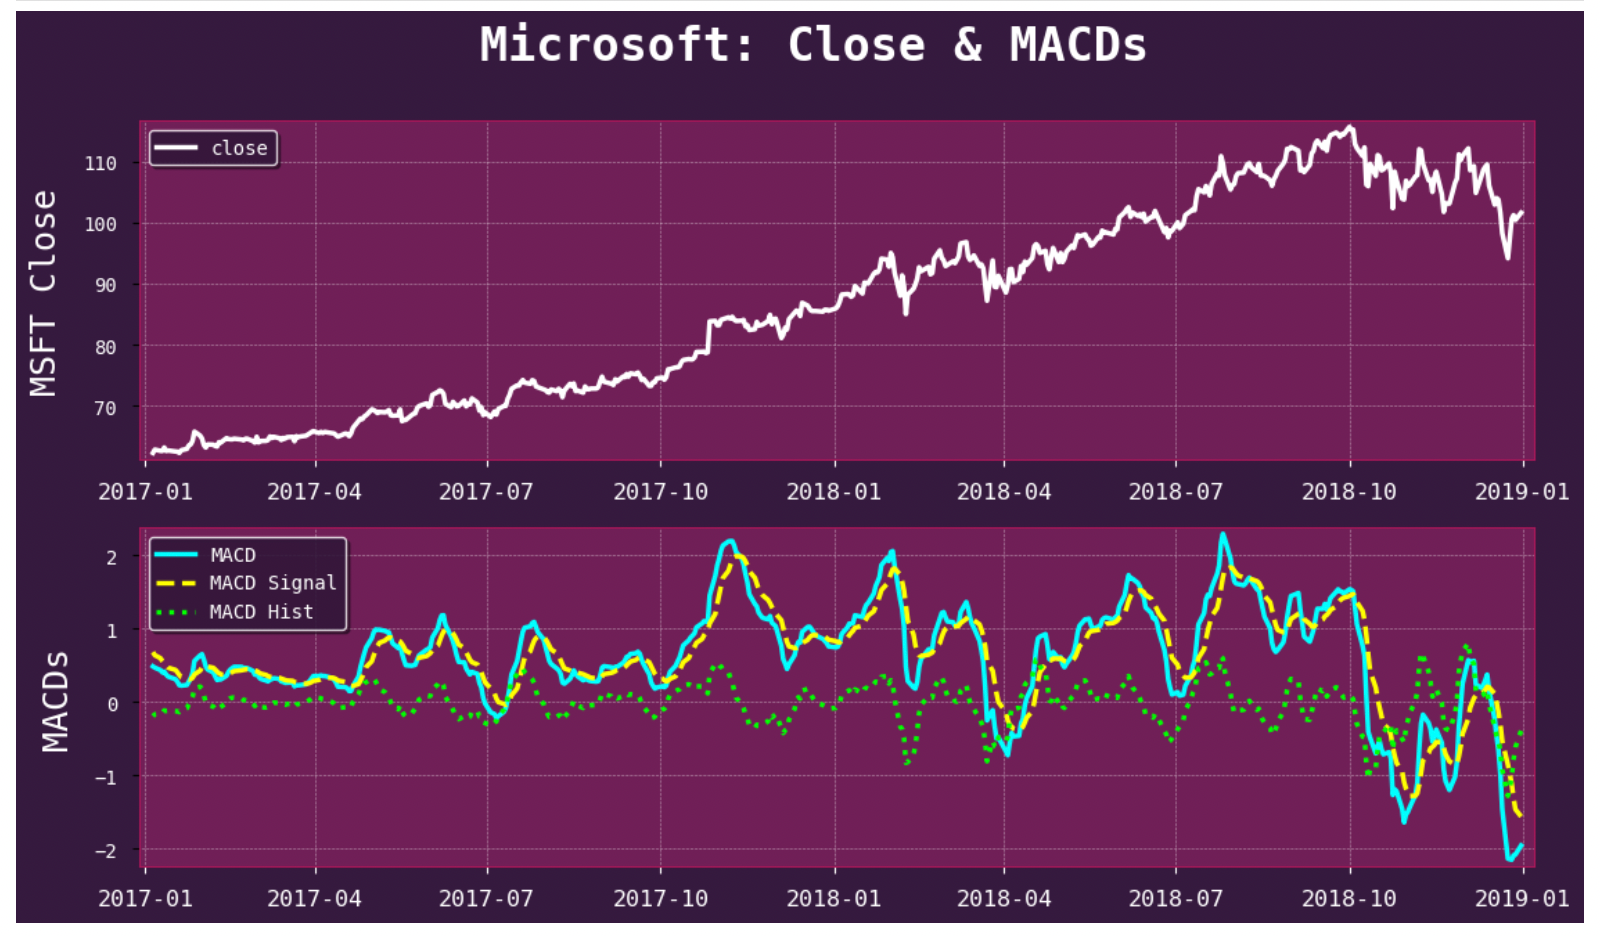
Next we will look at moving average convergence divergence. For convenience and clarity, I have included the explanation below, which comes from Investopedia.
(from Investopedia)
Moving average convergence/divergence (MACD, or MAC-D) is a trend-following momentum indicator that shows the relationship between two exponential moving averages (EMAs) of a security’s price. The MACD line is calculated by subtracting the 26-period EMA from the 12-period EMA.
The result of that calculation is the MACD line. A nine-day EMA of the MACD line is called the signal line, which is then plotted on top of the MACD line, which can function as a trigger for buy or sell signals. Traders may buy the security when the MACD line crosses above the signal line and sell—or short—the security when the MACD line crosses below the signal line. MACD indicators can be interpreted in several ways, but the more common methods are crossovers, divergences, and rapid rises/falls.
| Jump to: | Top | Getting Data | Splits & Dividends | The Datetime Index | Frequency & Intervals | Technical Indicators | Foreign Exchange | Cryptocurrencies | |
|---|
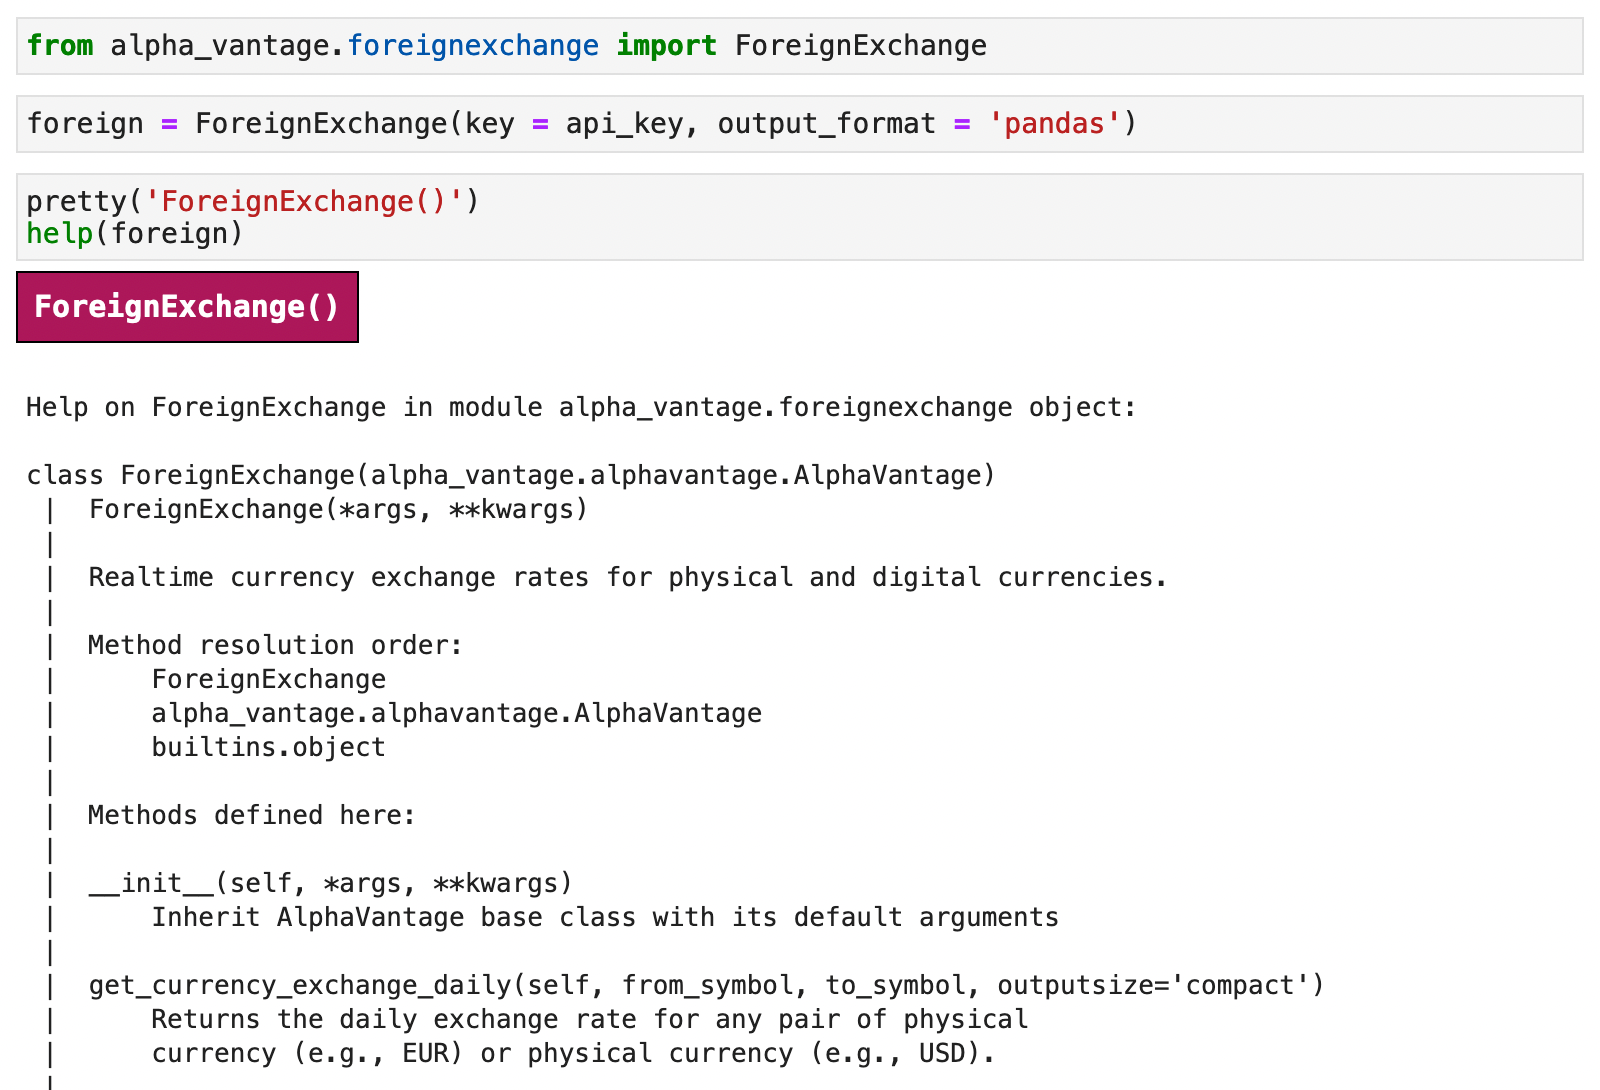
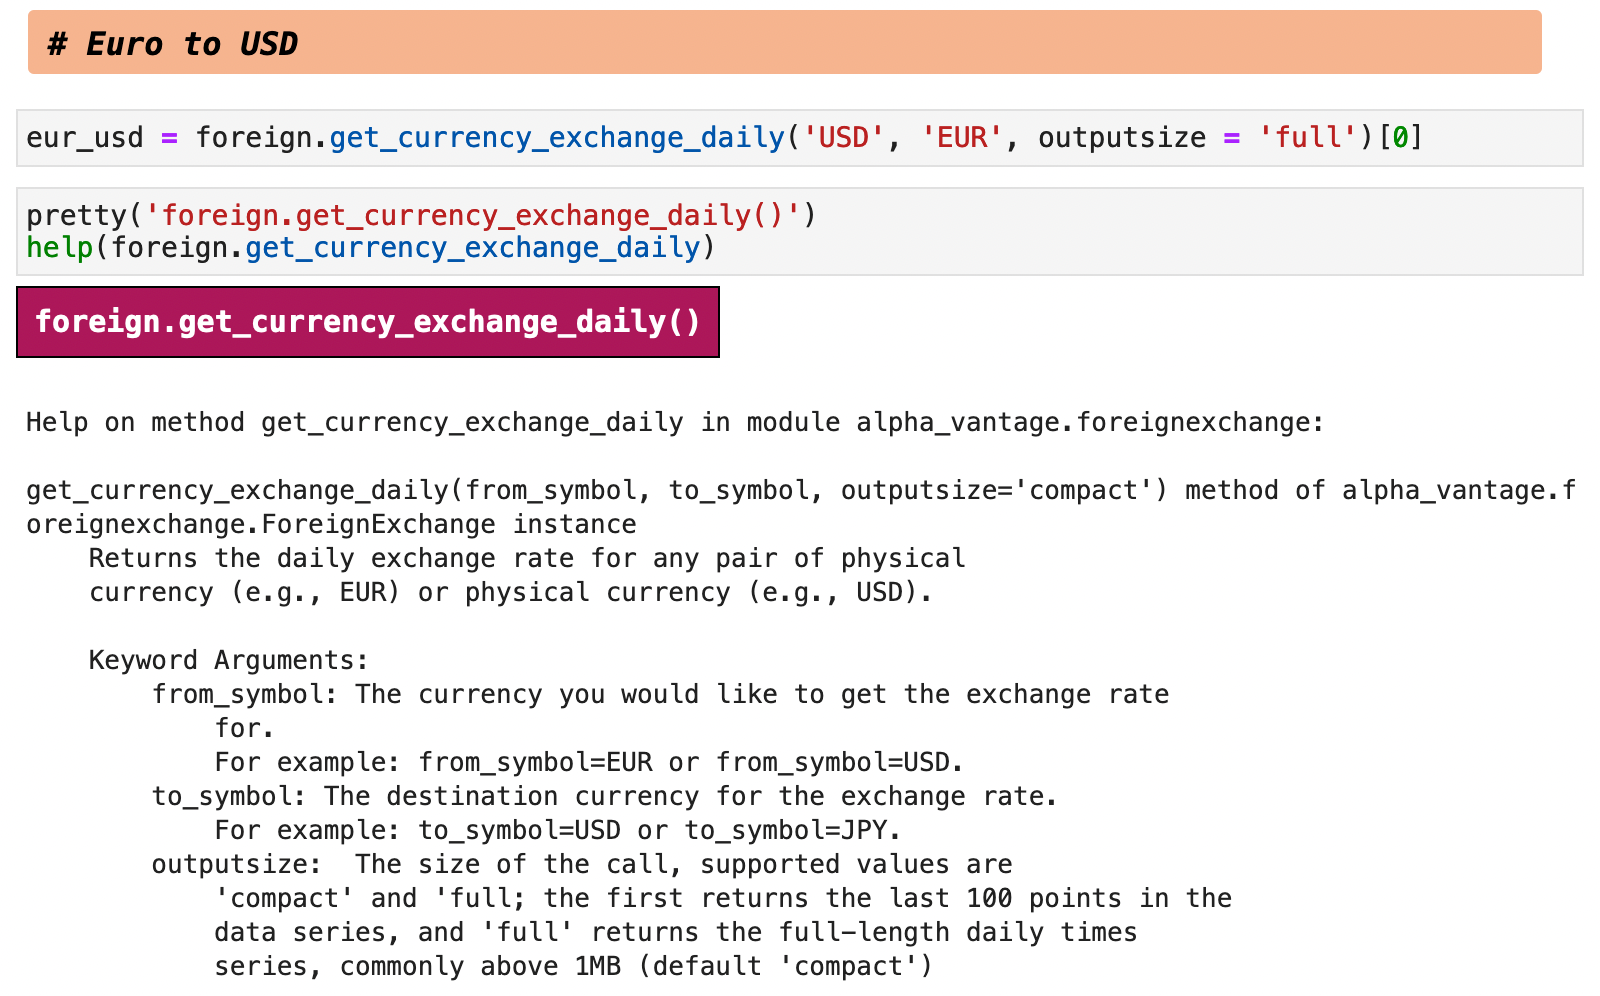
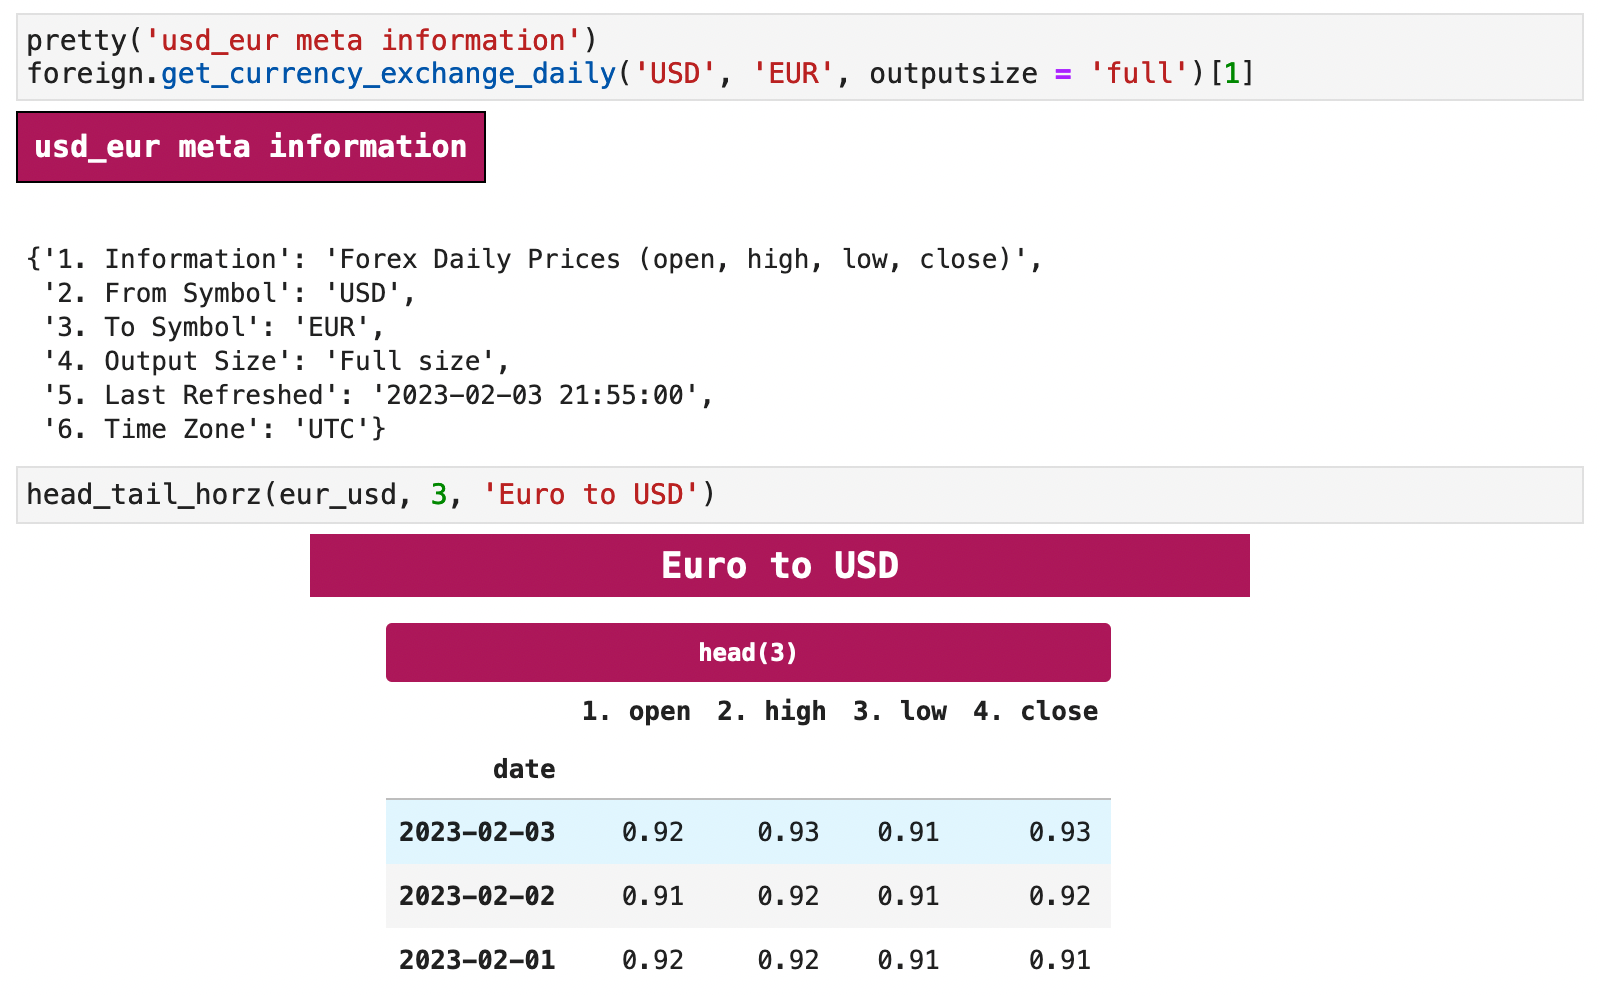
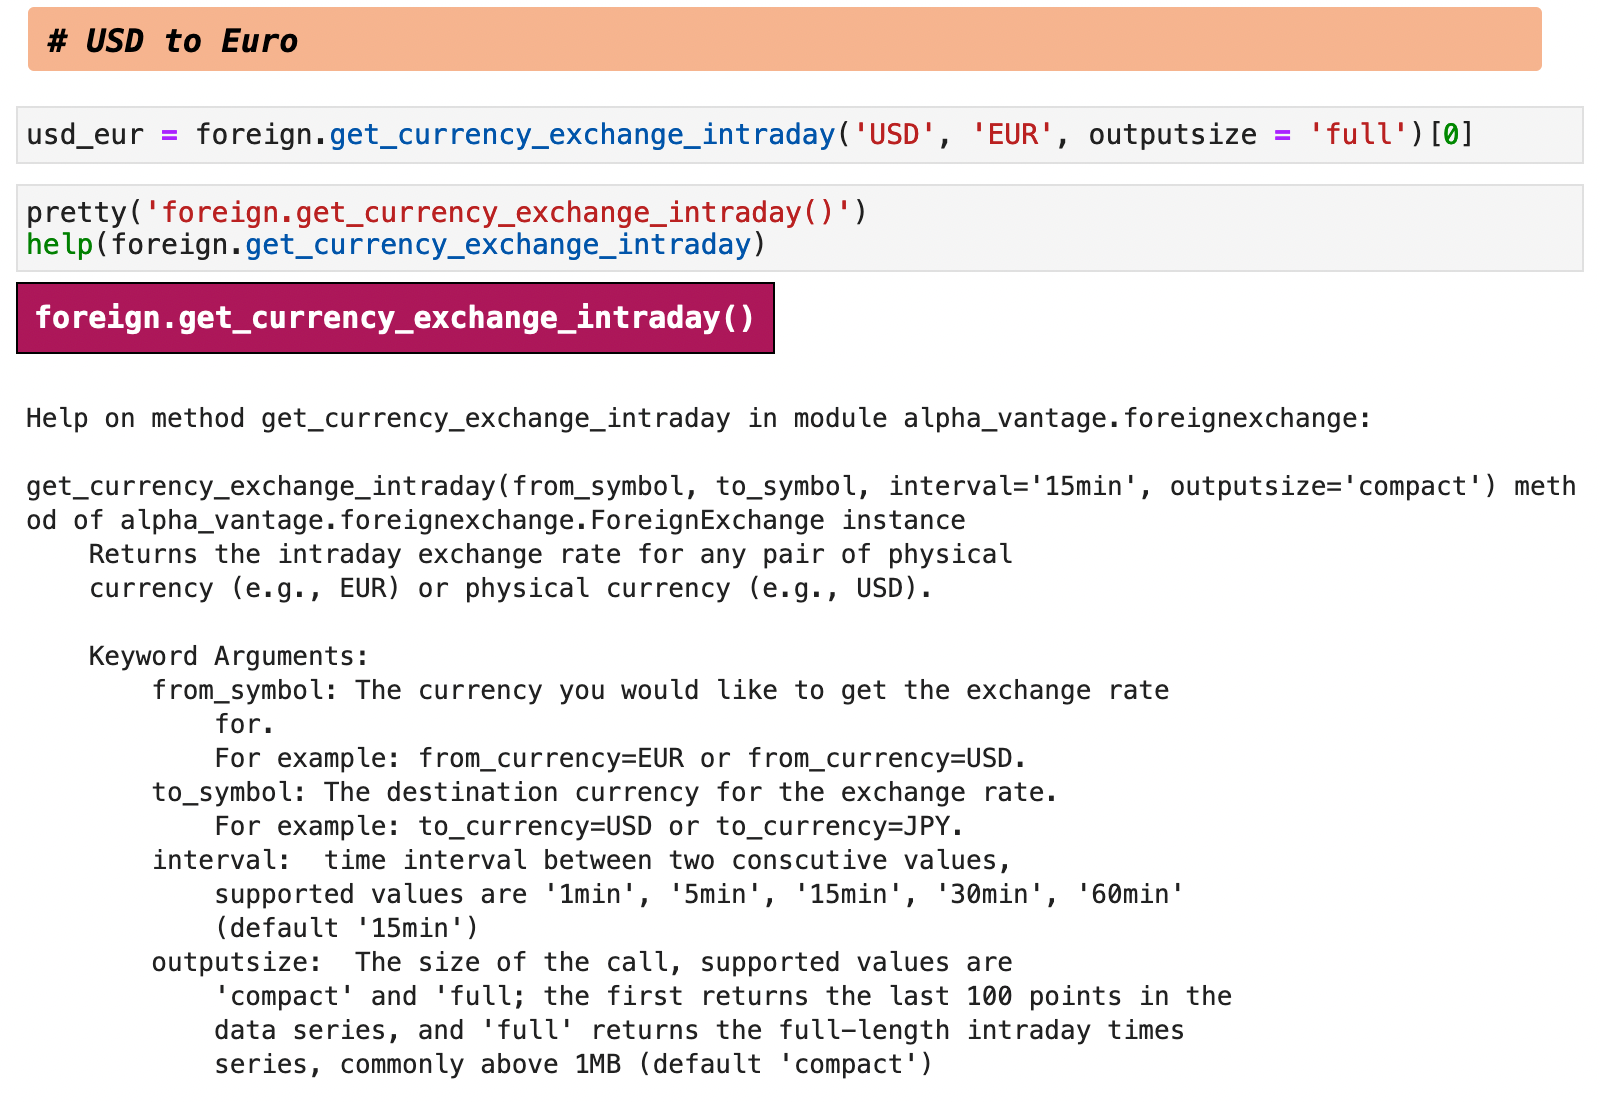
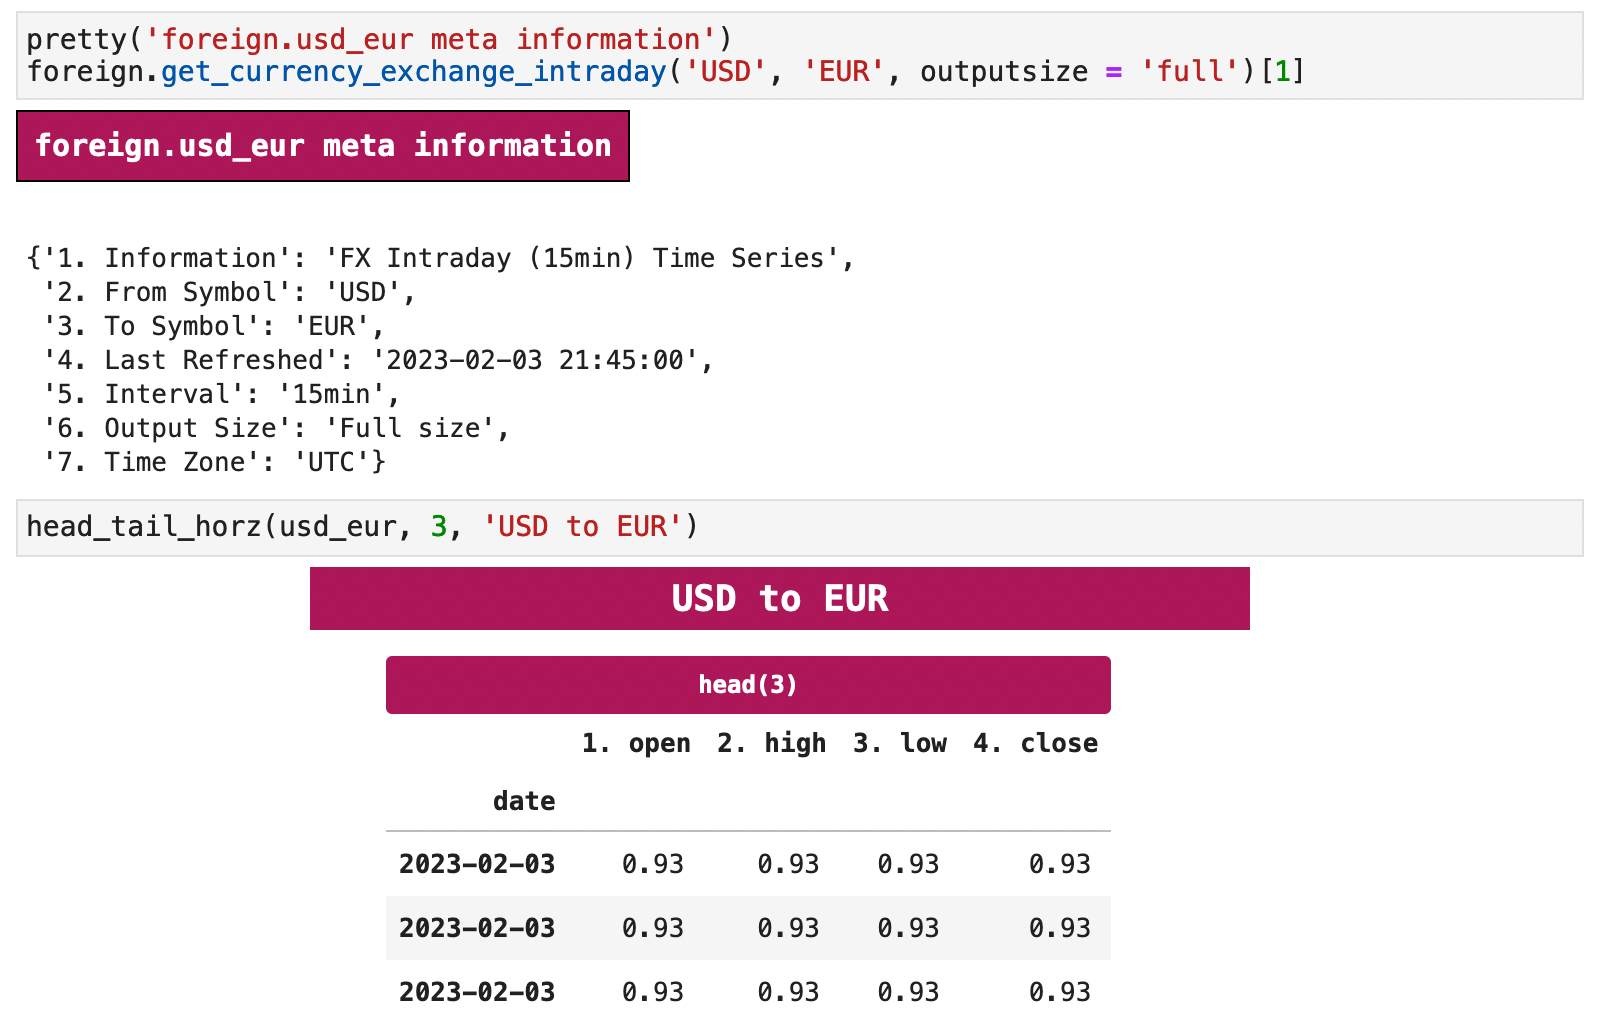
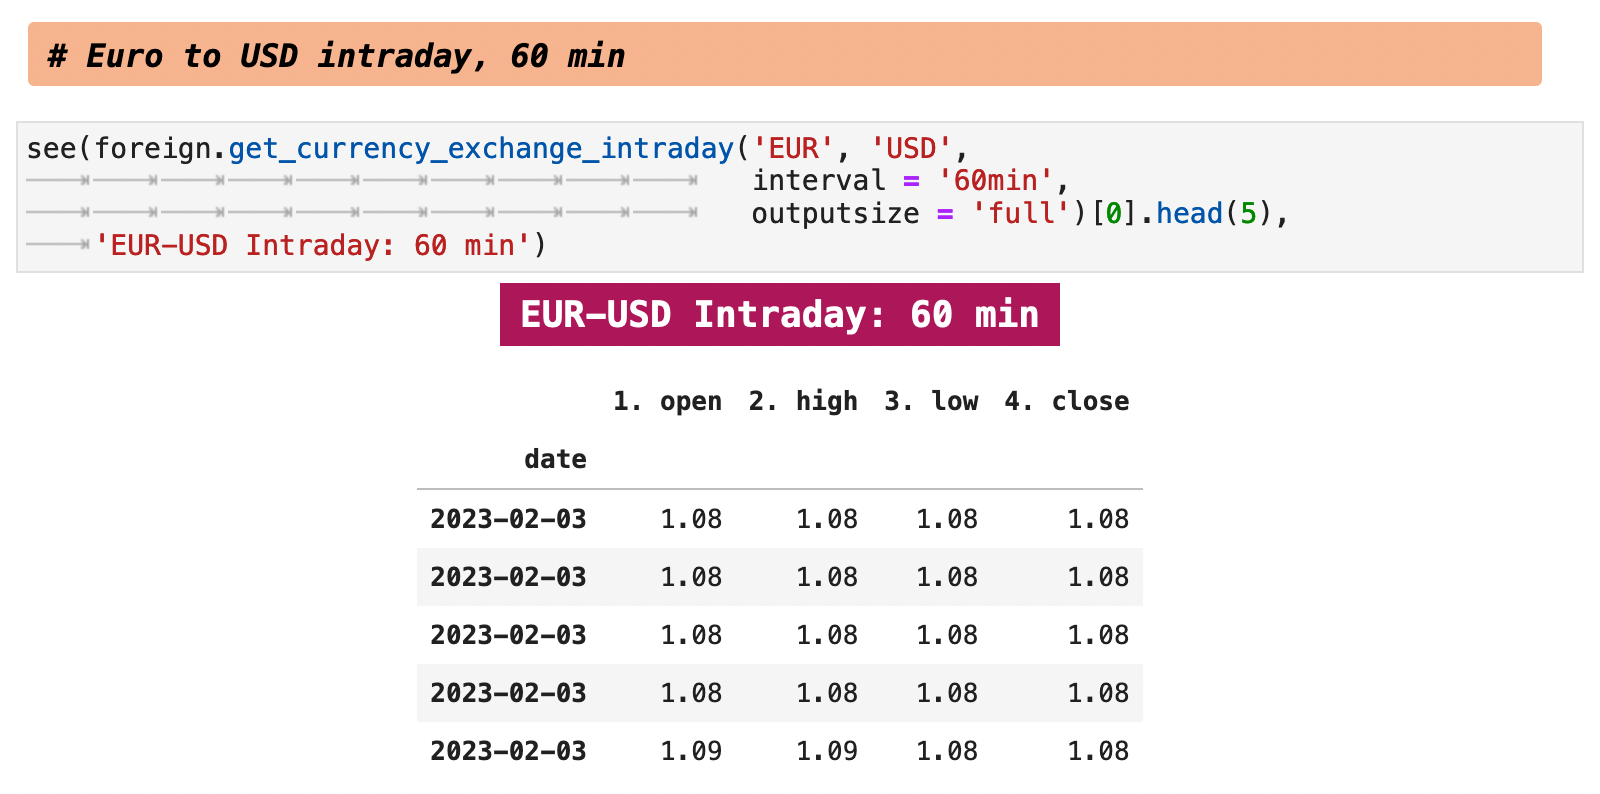
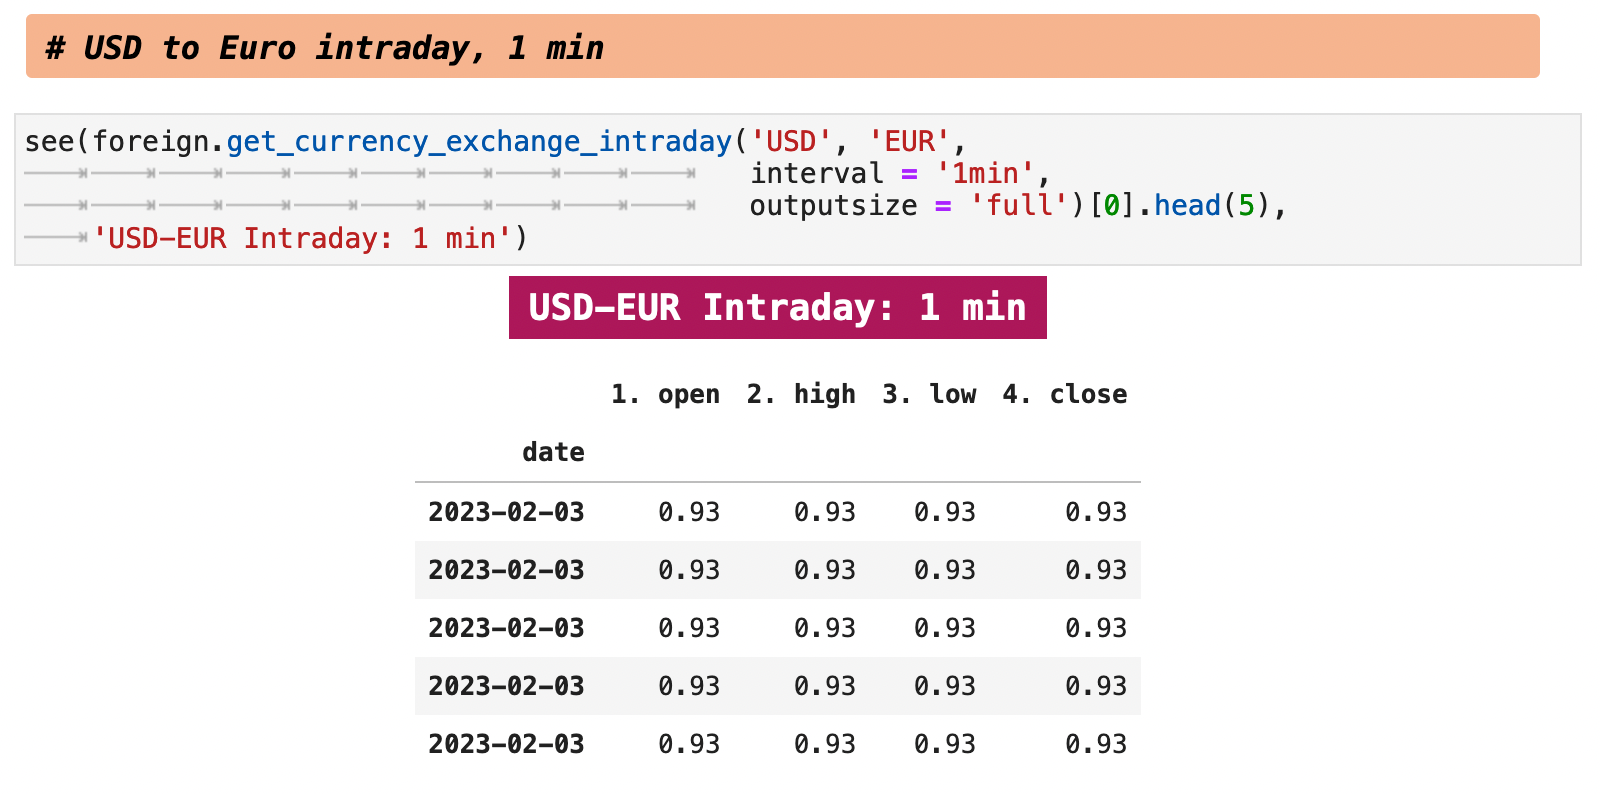
6. Foreign Exchange
Alpha Vantage also offers currencies and foreign exchange data. The cells below give a simple, brief overview of this functionality.
| Jump to: | Top | Getting Data | Splits & Dividends | The Datetime Index | Frequency & Intervals | Technical Indicators | Foreign Exchange | Cryptocurrencies | |
|---|
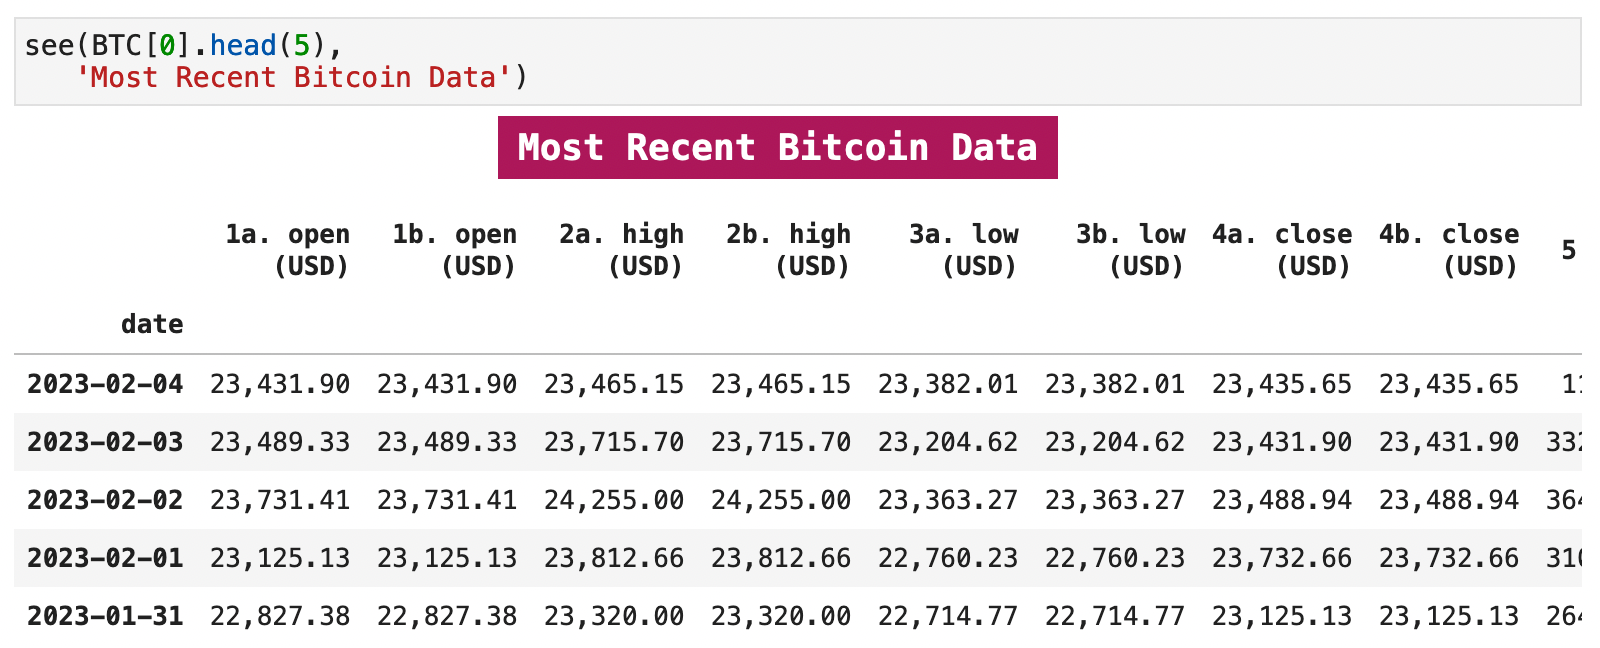
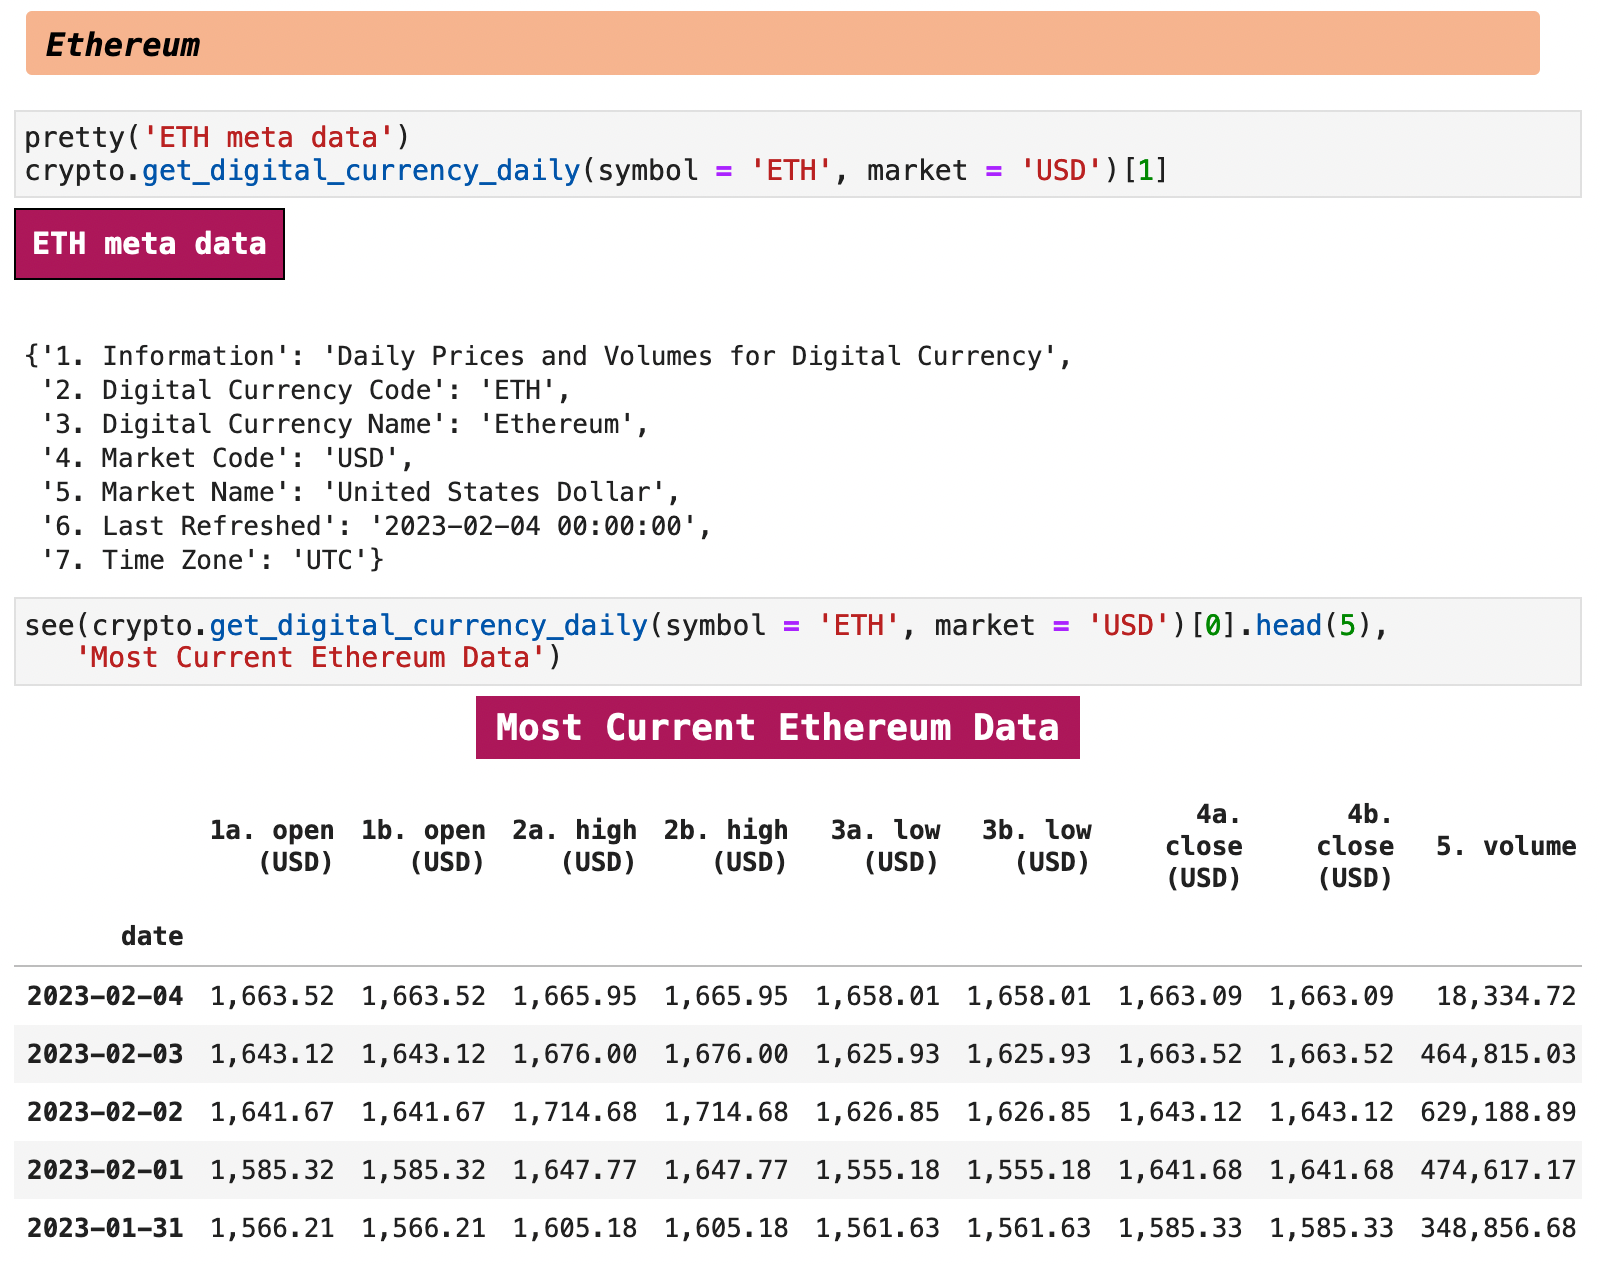
7. Cryptocurrencies
Aside from technical indicators, another place where Alpha Vantage shines is that they offer data on over 500 cryptocurrencies. The entire list of cryptocurrencies they cover can be found on their website and downloaded as a CSV file. I was honestly blown away by how many they offer. Here is a quick look at working with Alpha Vantage and cryptocurrencies by means of Bitcoin and Ethereum.
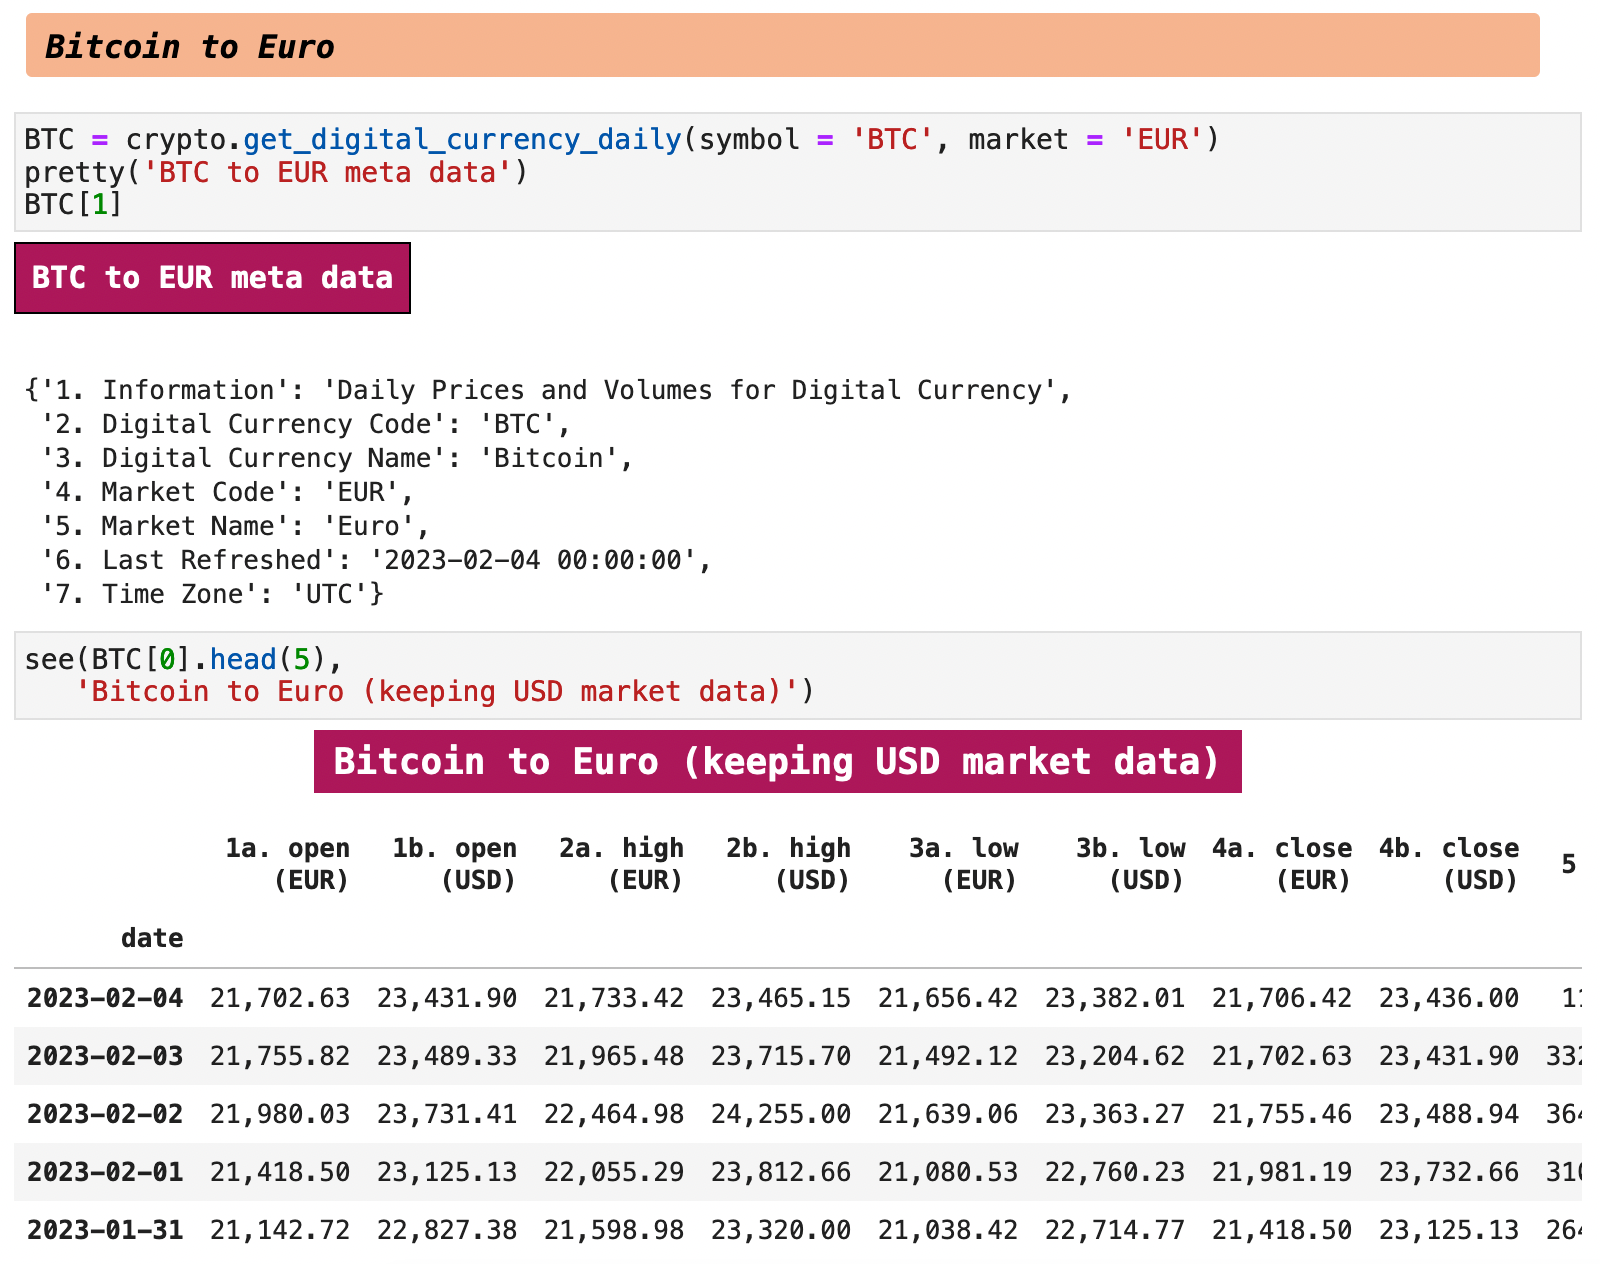
The duplicate columns below are due to the fact that Bitcoin is a US-traded currency, so Bitcoin data on Alpha Vantage will always also include the USD data columns as well.
Notice below that when we query Bitcoin and the Euro, we get the USD data as well as the Euro data. This reflects the US market basis as explained above.
That is all for our brief overview of Alpha Vantage. I hope you enjoyed it and learned something new and useful. Happy data wrangling!!
The Code: Embedded Jupyter | Interactive Jupyter | HTML
| Evan Marie 🌎: EvanMarie.com | EvanMarie@Proton.me | Linked In | GitHub | Hugging Face | Jovian.ai | CodeWars | TikTok | Discord ⇨ ✨ EvanMarie ✨#6114 | |
|---|
| Jump to: | Top | Getting Data | Splits & Dividends | The Datetime Index | Frequency & Intervals | Technical Indicators | Foreign Exchange | Cryptocurrencies | |
|---|